Gold price rises on Friday and ends a three-day decline, reaching the lowest point of the week.
…
This is a premium post.
[s2If !current_user_can(access_s2member_level4)]Please register for FREE REGISTER to read full post below containing analysis. In case of any error or you think you are not able to read the full post below, please email us at support#nehcap.com [lwa][/s2If] [s2If current_user_can(access_s2member_level1)]
- Gold gains some positive traction on Friday and snaps a three-day losing streak to the weekly low.
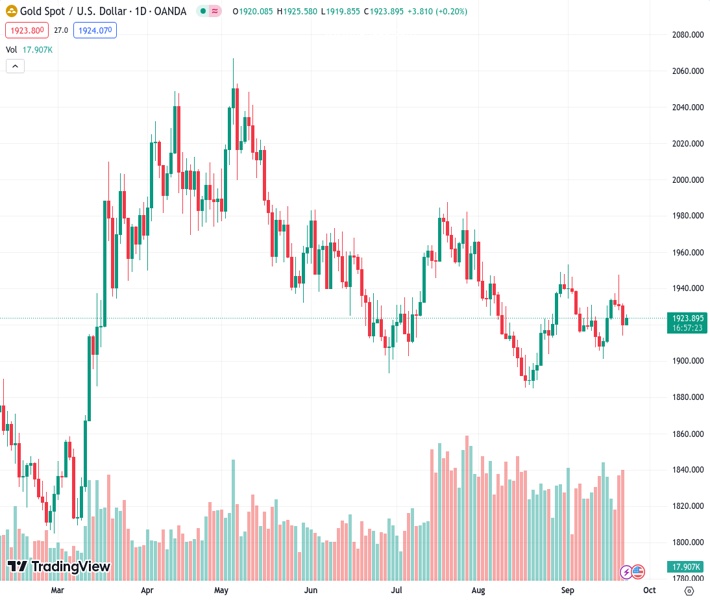
The pair currently trades last at 1923.75.
The previous day high was 1932.04 while the previous day low was 1913.95. The daily 38.2% Fib levels comes at 1920.86, expected to provide support. Similarly, the daily 61.8% fib level is at 1925.13, expected to provide resistance.
Gold price builds on the previous day’s bounce from the $1,914-$1,913 area, or the weekly low and gains some positive traction during the Asian session on Friday. The XAU/USD currently trades around the $1,925 region, up just over 0.20% for the day, and for now, seems to have snapped a three-day losing streak.
The intraday uptick in the Gold price, meanwhile, lacks any obvious fundamental catalyst and runs the risk of fizzling out rather quickly in the wake of the Federal Reserve’s (Fed) readiness to hike interest rates until inflation returns to its 2% target. In fact, the Fed warned that warned that still-sticky inflation in the United States (US) was likely to attract at least one more 25 basis points (bps) lift-off by the year-end.
Moreover, the so-called ‘dot-plot’ indicated that policymakers see the benchmark rate at 5.1% in 2024, suggesting just two rate cuts next year as compared to four projected previously. Adding to this, the US Labor Department reported on Thursday that the number of Americans filing new claims for unemployment-related benefits dropped to an eight-month low last week, pointing to persistent labour market tightness.
This should allow the Fed to keep rates higher for longer and lead to an extended selloff in the US fixed-income market, pushing the yield on the rate-sensitive two-year government bond to its highest level since July 2006. Moreover, the benchmark 10-year Treasury yield rose to a 16-year peak, which continues to underpin the Greenback and keep a lid on any meaningful appreciating move for the non-yielding Gold price.
Hence, it will be prudent to wait for strong follow-through buying before placing fresh bullish bets around the XAU/USD. Market participants now look forward to the release of the flash PMI prints, which will be looked upon for fresh insight into the health of the global economy. This, in turn, will influence the broader market risk sentiment, which should drive demand for traditional safe-haven assets and the Gold price.
Technical Levels: Supports and Resistances
XAUUSD currently trading at 1923.8 at the time of writing. Pair opened at 1920.08 and is trading with a change of 0.19 % .
| Overview | Overview.1 | |
|---|---|---|
| 0 | Today last price | 1923.80 |
| 1 | Today Daily Change | 3.72 |
| 2 | Today Daily Change % | 0.19 |
| 3 | Today daily open | 1920.08 |
The pair remains strongly bearish on the daily time frame. It trades below the 20 SMA @ 1925.47, 50 SMA 1930.63, 100 SMA @ 1943.18 and 200 SMA @ 1924.83.
| Trends | Trends.1 | |
|---|---|---|
| 0 | Daily SMA20 | 1925.47 |
| 1 | Daily SMA50 | 1930.63 |
| 2 | Daily SMA100 | 1943.18 |
| 3 | Daily SMA200 | 1924.83 |
The previous day high was 1932.04 while the previous day low was 1913.95. The daily 38.2% Fib levels comes at 1920.86, expected to provide support. Similarly, the daily 61.8% fib level is at 1925.13, expected to provide resistance.
Note the levels of interest below:
- Pivot support is noted at 1912.01, 1903.93, 1893.92
- Pivot resistance is noted at 1930.1, 1940.11, 1948.19
| Levels | Levels.1 |
|---|---|
| Previous Daily High | 1932.04 |
| Previous Daily Low | 1913.95 |
| Previous Weekly High | 1930.77 |
| Previous Weekly Low | 1901.07 |
| Previous Monthly High | 1966.08 |
| Previous Monthly Low | 1884.85 |
| Daily Fibonacci 38.2% | 1920.86 |
| Daily Fibonacci 61.8% | 1925.13 |
| Daily Pivot Point S1 | 1912.01 |
| Daily Pivot Point S2 | 1903.93 |
| Daily Pivot Point S3 | 1893.92 |
| Daily Pivot Point R1 | 1930.10 |
| Daily Pivot Point R2 | 1940.11 |
| Daily Pivot Point R3 | 1948.19 |
[/s2If]
Download Nehcap EAWe have two EAs that are operational on our LIVE accounts.
- EA-FIX: Check out the details here. Download EA-FIX . EA-FIX is a non-grid HFT scalper.
- EA-GROWTH: High quality low dd EA using trend grids. Download EA_GROWTHJoin Our Telegram Group
")


