The USDJPY pair experienced a drop and fell close to 147.50.
…
This is a premium post.
[s2If !current_user_can(access_s2member_level4)]Please register for FREE REGISTER to read full post below containing analysis. In case of any error or you think you are not able to read the full post below, please email us at support#nehcap.com [lwa][/s2If] [s2If current_user_can(access_s2member_level1)]
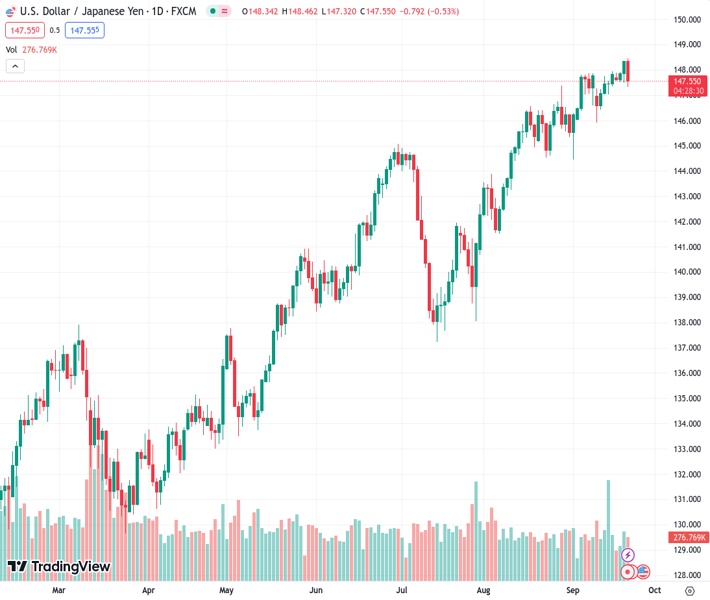
- The USD/JPY took a hit and declined near 147.50.
The pair currently trades last at 147.550.
The previous day high was 148.36 while the previous day low was 147.48. The daily 38.2% Fib levels comes at 148.02, expected to provide resistance. Similarly, the daily 61.8% fib level is at 147.81, expected to provide resistance.
On Thursday, the USD/JPY faced downward pressure, declining near 147.50 and seeing 0.60% losses. On the one hand, hopes of a Bank of Japan (BoJ) policy shift (or a signal) keep the JPY afloat while the USD is holding its ground, driven by US Treasury yields rallying after the Federal Reserve (Fed) decision on Wednesday.
Despite the JPY trading strong against most of its rivals, the BoJ may disappoint markets on Friday and keep its dovish stance. As highlighted, local wage and inflation trends are key drivers in the decision-making process around monetary policy shifts so until those figures don’t align with the bank’s forecast, they won’t consider leaving their negative interest rate policy. However, any additional clues the BoJ gives in its statement will help investors model their expectations regarding the next meetings and affect Yen’s price dynamics.
On the other hand, the Federal Reserve (Fed) was more hawkish than expected on its September meeting with its rate projections as they hinted at one more hike in 2023 and practically delayed rate cuts in 2024. The combination of higher and higher interest rates for longer fueled the US Dollar via higher Treasury yields, which stand at multi-year highs. The 2-year rate is 5.16%, while the 5 and 10-year yields soared to 4.60% and 4.47%, respectively.
Moreover, the US reported mixed data during the session, as Jobless Claims for the second week of September were lower than expected, while the Philadelphia’s Fed Manufacturing Survey declined to 13.5, missing by wide margin expectations. It’s worth mentioning that despite the Fed being hawkish in interest rate terms, Chair Powell noted that the next decisions will rely solely on incoming data, so the US price dynamics will see volatility on releasing high-tier economic figures. On Friday, markets await September S&P Global PMI figures.
Despite the daily declines, the USD/JPY suggest that the outlook for the pair on the daily chart is still bullish. The Relative Strength Index (RSI) is favourably positioned in positive territory above its midline but reflects a downward movement. Similarly, Moving Average Convergence Divergence (MACD) depicts red bars, affirming that the bears are gaining ground but aren’t there yet. In line with that, the pair is above the 20,100,200-day Simple Moving Average (SMA), suggesting that the bulls are firmly in control of the bigger picture.
Support levels: 147.10 (20-day SMA), 146.00, 145.00
Resistance levels: 148.00, 149.00, 150.00.
Technical Levels: Supports and Resistances
USDJPY currently trading at 147.49 at the time of writing. Pair opened at 148.35 and is trading with a change of -0.58 % .
| Overview | Overview.1 | |
|---|---|---|
| 0 | Today last price | 147.49 |
| 1 | Today Daily Change | -0.86 |
| 2 | Today Daily Change % | -0.58 |
| 3 | Today daily open | 148.35 |
The pair remains strongly bullish on the daily timeframe. It trades above its 20 SMA @ 147.0, 50 SMA 144.35, 100 SMA @ 142.17 and 200 SMA @ 137.53.
| Trends | Trends.1 | |
|---|---|---|
| 0 | Daily SMA20 | 147.00 |
| 1 | Daily SMA50 | 144.35 |
| 2 | Daily SMA100 | 142.17 |
| 3 | Daily SMA200 | 137.53 |
The previous day high was 148.36 while the previous day low was 147.48. The daily 38.2% Fib levels comes at 148.02, expected to provide resistance. Similarly, the daily 61.8% fib level is at 147.81, expected to provide resistance.
Note the levels of interest below:
- Pivot support is noted at 147.76, 147.17, 146.87
- Pivot resistance is noted at 148.65, 148.95, 149.53
| Levels | Levels.1 |
|---|---|
| Previous Daily High | 148.36 |
| Previous Daily Low | 147.48 |
| Previous Weekly High | 147.95 |
| Previous Weekly Low | 145.90 |
| Previous Monthly High | 147.38 |
| Previous Monthly Low | 141.51 |
| Daily Fibonacci 38.2% | 148.02 |
| Daily Fibonacci 61.8% | 147.81 |
| Daily Pivot Point S1 | 147.76 |
| Daily Pivot Point S2 | 147.17 |
| Daily Pivot Point S3 | 146.87 |
| Daily Pivot Point R1 | 148.65 |
| Daily Pivot Point R2 | 148.95 |
| Daily Pivot Point R3 | 149.53 |
[/s2If]
Download Nehcap EAWe have two EAs that are operational on our LIVE accounts.
- EA-FIX: Check out the details here. Download EA-FIX . EA-FIX is a non-grid HFT scalper.
- EA-GROWTH: High quality low dd EA using trend grids. Download EA_GROWTHJoin Our Telegram Group
")


