The New Zealand Dollar to US Dollar exchange rate experienced a decline on Thursday; however, it rebounded during midday as the US Dollar showed signs of pausing or taking a break.
…
This is a premium post.
[s2If !current_user_can(access_s2member_level4)]Please register for FREE REGISTER to read full post below containing analysis. In case of any error or you think you are not able to read the full post below, please email us at support#nehcap.com [lwa][/s2If] [s2If current_user_can(access_s2member_level1)]
- The NZD/USD fell on Thursday, but recovered in the midday as the US Dollar takes a breather.
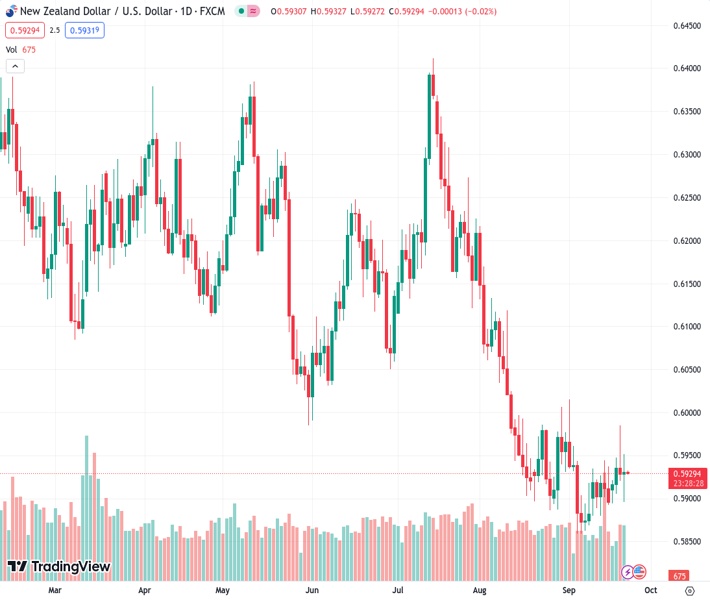
The pair currently trades last at 0.59280.
The previous day high was 0.5987 while the previous day low was 0.592. The daily 38.2% Fib levels comes at 0.5946, expected to provide resistance. Similarly, the daily 61.8% fib level is at 0.5962, expected to provide resistance.
The NZD/USD got knocked lower following a hawkish Fed on Wednesday, tumbling 1.5% before the Kiwi (NZD) managed to find a floor near 0.5895.
The trading week will cap off action with Purchasing Manager Index (PMI) figures for both New Zealand and the US markets.
The Federal Reserve (Fed) held benchmark interest rates at 5.5% on Wednesday, but the US central bank is forecasting that rates will remain higher for longer than previously anticipated. 2024’s year-end interest rate is currently expected to be 5.1%, compared to the previously forecast 4.6%.
With the Fed hitting hawkish notes, the US Dollar (USD) climbed across the entire global currency market. Thursday saw the Greenback continue its march until the midday, where currency counterparts found some breathing room and eased back recent losses.
Friday markets will finish up the trading week with NZ and US PMIs, but NZ PMIs are unlikely to drive much market momentum. Most investors will be keeping their eyes turned to the US PMI release, where the manufacturing and services components are anticipated to tick upwards, albeit slightly.
The US Manufacturing PMI component is seen rising to 48.0 from 47.9, while the services sector is expected to rise from 50.5 to 50.6.
The Kiwi-Dollar pairing fell through the 200-hour Simple Moving Average (SMA) early Thursday, slipping to a near-term low of 0.5895. Hourly candles could see the NZD/USD slip back to the 200-hour SMA is bullish momentum falters or Dollar bulls return to the fold.
Daily candlesticks see the Kiwi trading into familiar five-week ranges after getting knocked back from the 34-day Exponential Moving Average (EMA) just above 0.5950.
A sustained bull move will see technical resistance from the 200-day Simple Moving Average (SMA) drifting below the 0.6200 handle, while further downside sees little in the way of support until 2022’s late low far below current price action, near 0.5500.
Technical Levels: Supports and Resistances
NZDUSD currently trading at 0.5931 at the time of writing. Pair opened at 0.5929 and is trading with a change of 0.03 % .
| Overview | Overview.1 | |
|---|---|---|
| 0 | Today last price | 0.5931 |
| 1 | Today Daily Change | 0.0002 |
| 2 | Today Daily Change % | 0.0300 |
| 3 | Today daily open | 0.5929 |
The pair is trading above its 20 Daily moving average @ 0.5918, below its 50 Daily moving average @ 0.6035 , below its 100 Daily moving average @ 0.6103 and below its 200 Daily moving average @ 0.6192
| Trends | Trends.1 | |
|---|---|---|
| 0 | Daily SMA20 | 0.5918 |
| 1 | Daily SMA50 | 0.6035 |
| 2 | Daily SMA100 | 0.6103 |
| 3 | Daily SMA200 | 0.6192 |
The previous day high was 0.5987 while the previous day low was 0.592. The daily 38.2% Fib levels comes at 0.5946, expected to provide resistance. Similarly, the daily 61.8% fib level is at 0.5962, expected to provide resistance.
Note the levels of interest below:
- Pivot support is noted at 0.5904, 0.5878, 0.5836
- Pivot resistance is noted at 0.5971, 0.6013, 0.6038
| Levels | Levels.1 |
|---|---|
| Previous Daily High | 0.5987 |
| Previous Daily Low | 0.5920 |
| Previous Weekly High | 0.5945 |
| Previous Weekly Low | 0.5880 |
| Previous Monthly High | 0.6219 |
| Previous Monthly Low | 0.5885 |
| Daily Fibonacci 38.2% | 0.5946 |
| Daily Fibonacci 61.8% | 0.5962 |
| Daily Pivot Point S1 | 0.5904 |
| Daily Pivot Point S2 | 0.5878 |
| Daily Pivot Point S3 | 0.5836 |
| Daily Pivot Point R1 | 0.5971 |
| Daily Pivot Point R2 | 0.6013 |
| Daily Pivot Point R3 | 0.6038 |
[/s2If]
Download Nehcap EAWe have two EAs that are operational on our LIVE accounts.
- EA-FIX: Check out the details here. Download EA-FIX . EA-FIX is a non-grid HFT scalper.
- EA-GROWTH: High quality low dd EA using trend grids. Download EA_GROWTHJoin Our Telegram Group
")


