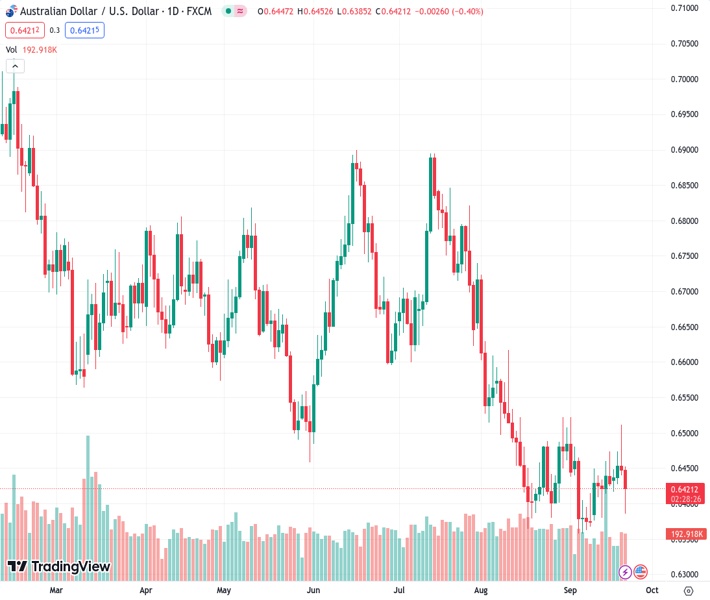
The Australian dollar to US dollar exchange rate is rising towards the end of trading on Thursday as market sentiment improves.
…
This is a premium post.
[s2If !current_user_can(access_s2member_level4)]Please register for FREE REGISTER to read full post below containing analysis. In case of any error or you think you are not able to read the full post below, please email us at support#nehcap.com [lwa][/s2If] [s2If current_user_can(access_s2member_level1)]
- The AUD/USD is recovering into the back end of Thursday trading as risk appetite recovers.
The pair currently trades last at 0.64242.
The previous day high was 0.6511 while the previous day low was 0.644. The daily 38.2% Fib levels comes at 0.6467, expected to provide resistance. Similarly, the daily 61.8% fib level is at 0.6484, expected to provide resistance.
The AUD/USD is catching a bounce heading into the back end of Thursday’s market session, lifting into 0.6425 after hitting a near-term low of 0.6385.
The US Dollar (USD) took a ride up the charts across the board after yesterday’s Federal Reserve (Fed) which saw the US central bank hold rates steady for the time being, but an increase in the Fed’s rate outlook sees markets baking in at least one more rate hike for the year.
The Federal Open Market Committee (FOMC) sees the US interest rate at 5.1% by the end of 2024, a half-percentage point higher than originally expected. The potential for higher, longer Fed rates saw the Greenback gain ground against all of its global competitors, and markets are still scrambling to correct the slide.
Friday markets will see Purchasing Manager Index (PMI) figures for both the AUD and the USD.
The Australian Composite PMI last printed at 48, while the US Composite PMI last came in at 50.2. Purchasing managers in both economies are seeing a discrepancy in economic activity. US purchasing managers see activity and prices rising in September, while their Australian counterparts are still facing a steepening of constraint factors for the Antipodean economy.
The Aussie tumbled from a near-term peak of 0.6510 on Thursday after the Fed threw gas over the USD, and the AUD/USD fell nearly 2% before recovering from a new floor at 0.6385.
The pair has slipped below the 200-hour Simple Moving Average (SMA) near 0.6440, and fallen to the bearish side of a rising trendline on hourly candles from last week’s low end near 0.6370.
On the daily candlesticks, the AUD/USD continues to fall back into familiar consolidation territory. Wednesday’s backslide saw the pair cleanly reject the 34-day Exponential Moving Average (EMA), and technical support comes from recent swing lows below 0.6375.
Technical Levels: Supports and Resistances
AUDUSD currently trading at 0.6426 at the time of writing. Pair opened at 0.6448 and is trading with a change of -0.34 % .
| Overview | Overview.1 | |
|---|---|---|
| 0 | Today last price | 0.6426 |
| 1 | Today Daily Change | -0.0022 |
| 2 | Today Daily Change % | -0.3400 |
| 3 | Today daily open | 0.6448 |
The pair remains strongly bearish on the daily time frame. It trades below the 20 SMA @ 0.643, 50 SMA 0.6541, 100 SMA @ 0.6611 and 200 SMA @ 0.6699.
| Trends | Trends.1 | |
|---|---|---|
| 0 | Daily SMA20 | 0.6430 |
| 1 | Daily SMA50 | 0.6541 |
| 2 | Daily SMA100 | 0.6611 |
| 3 | Daily SMA200 | 0.6699 |
The previous day high was 0.6511 while the previous day low was 0.644. The daily 38.2% Fib levels comes at 0.6467, expected to provide resistance. Similarly, the daily 61.8% fib level is at 0.6484, expected to provide resistance.
Note the levels of interest below:
- Pivot support is noted at 0.6421, 0.6395, 0.635
- Pivot resistance is noted at 0.6493, 0.6538, 0.6564
| Levels | Levels.1 |
|---|---|
| Previous Daily High | 0.6511 |
| Previous Daily Low | 0.6440 |
| Previous Weekly High | 0.6474 |
| Previous Weekly Low | 0.6378 |
| Previous Monthly High | 0.6724 |
| Previous Monthly Low | 0.6364 |
| Daily Fibonacci 38.2% | 0.6467 |
| Daily Fibonacci 61.8% | 0.6484 |
| Daily Pivot Point S1 | 0.6421 |
| Daily Pivot Point S2 | 0.6395 |
| Daily Pivot Point S3 | 0.6350 |
| Daily Pivot Point R1 | 0.6493 |
| Daily Pivot Point R2 | 0.6538 |
| Daily Pivot Point R3 | 0.6564 |
[/s2If]
Download Nehcap EAWe have two EAs that are operational on our LIVE accounts.
- EA-FIX: Check out the details here. Download EA-FIX . EA-FIX is a non-grid HFT scalper.
- EA-GROWTH: High quality low dd EA using trend grids. Download EA_GROWTHJoin Our Telegram Group
")


