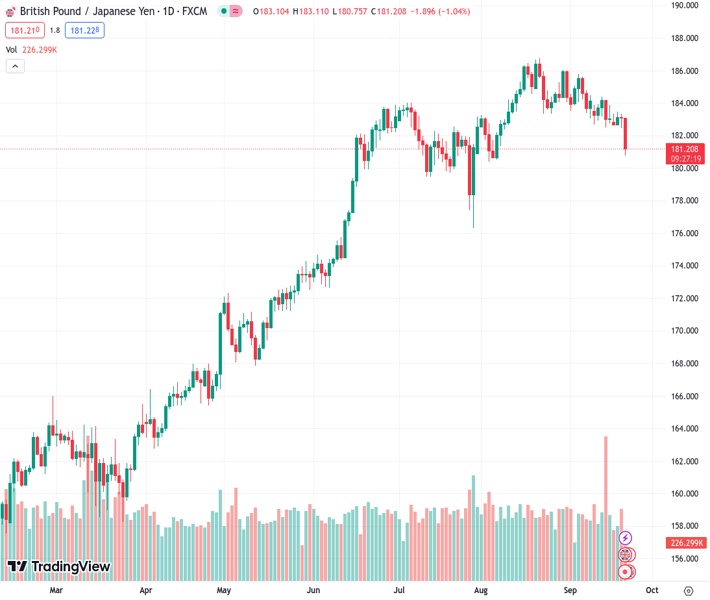
On Thursday, the GBPJPY pair at 181.248 experienced strong downward pressure from bearish market conditions and fell to its lowest level in several weeks.
…
This is a premium post.
[s2If !current_user_can(access_s2member_level4)]Please register for FREE REGISTER to read full post below containing analysis. In case of any error or you think you are not able to read the full post below, please email us at support#nehcap.com [lwa][/s2If] [s2If current_user_can(access_s2member_level1)]
- GBP/JPY came under heavy bearish pressure and dropped to multi-week lows on Thursday.
The pair currently trades last at 181.248.
The previous day high was 183.35 while the previous day low was 182.46. The daily 38.2% Fib levels comes at 182.8, expected to provide resistance. Similarly, the daily 61.8% fib level is at 183.01, expected to provide resistance.
GBP/JPY turned south in the European session on Thursday and dropped to its lowest level since early August at 180.83 before recovering to the 181.50 area. As of writing, the pair was down 0.9% on the day at 181.54.
Following the September policy meeting, the Bank of England (BoE) decided to leave the interest rate unchanged at 5.25%. Although investors were expecting the BoE to raise the policy rate by 25 basis points, soft inflation data from the UK revived expectations for a no change. “inflation has fallen a lot in recent months, we think it will continue to do so,” the BoE said in its policy statement.
Nevertheless, the immediate reaction caused Pound Sterling to suffer large losses against its major rivals. GBP/USD was last seen losing 0.6% on the day and EUR/GBP was up 0.4% at 0.8670, highlighting the negative impact of the BoE’s policy decision on the currency.
According to Reuters, the chance of the BoE raising rates by 25 bps in November declined to 64% from 81% before the rate decision.
During the Asian trading hours on Friday, the Bank of Japan will announce its monetary policy decisions. Investors expect the BoJ to keep its policy settings, including the yield curve control strategy, unchanged.
Technical Levels: Supports and Resistances
GBPJPY currently trading at 181.58 at the time of writing. Pair opened at 183.12 and is trading with a change of -0.84 % .
| Overview | Overview.1 | |
|---|---|---|
| 0 | Today last price | 181.58 |
| 1 | Today Daily Change | -1.54 |
| 2 | Today Daily Change % | -0.84 |
| 3 | Today daily open | 183.12 |
The pair is trading below its 20 Daily moving average @ 184.06, below its 50 Daily moving average @ 183.26 , above its 100 Daily moving average @ 179.83 and above its 200 Daily moving average @ 171.08
| Trends | Trends.1 | |
|---|---|---|
| 0 | Daily SMA20 | 184.06 |
| 1 | Daily SMA50 | 183.26 |
| 2 | Daily SMA100 | 179.83 |
| 3 | Daily SMA200 | 171.08 |
The previous day high was 183.35 while the previous day low was 182.46. The daily 38.2% Fib levels comes at 182.8, expected to provide resistance. Similarly, the daily 61.8% fib level is at 183.01, expected to provide resistance.
Note the levels of interest below:
- Pivot support is noted at 182.61, 182.09, 181.72
- Pivot resistance is noted at 183.49, 183.86, 184.38
| Levels | Levels.1 |
|---|---|
| Previous Daily High | 183.35 |
| Previous Daily Low | 182.46 |
| Previous Weekly High | 184.39 |
| Previous Weekly Low | 182.52 |
| Previous Monthly High | 186.77 |
| Previous Monthly Low | 180.46 |
| Daily Fibonacci 38.2% | 182.80 |
| Daily Fibonacci 61.8% | 183.01 |
| Daily Pivot Point S1 | 182.61 |
| Daily Pivot Point S2 | 182.09 |
| Daily Pivot Point S3 | 181.72 |
| Daily Pivot Point R1 | 183.49 |
| Daily Pivot Point R2 | 183.86 |
| Daily Pivot Point R3 | 184.38 |
[/s2If]
Download Nehcap EAWe have two EAs that are operational on our LIVE accounts.
- EA-FIX: Check out the details here. Download EA-FIX . EA-FIX is a non-grid HFT scalper.
- EA-GROWTH: High quality low dd EA using trend grids. Download EA_GROWTHJoin Our Telegram Group
")


