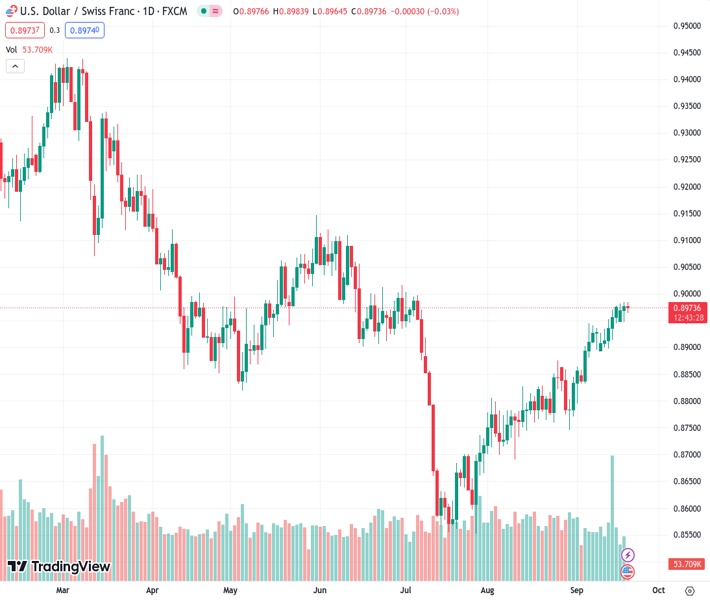
The USDCHF pair, currently trading at 0.89751, is reversing its previous upward movement as it prepares for the upcoming policy decision from the Federal Reserve.
…
This is a premium post.
[s2If !current_user_can(access_s2member_level4)]Please register for FREE REGISTER to read full post below containing analysis. In case of any error or you think you are not able to read the full post below, please email us at support#nehcap.com [lwa][/s2If] [s2If current_user_can(access_s2member_level1)]
- USD/CHF retraces the recent gains ahead of the policy decision by the Fed.
The pair currently trades last at 0.89751.
The previous day high was 0.8984 while the previous day low was 0.8948. The daily 38.2% Fib levels comes at 0.897, expected to provide support. Similarly, the daily 61.8% fib level is at 0.8962, expected to provide support.
USD/CHF snaps the previous day’s gains, trading lower around 0.8980 during the European session on Wednesday. The US Dollar (USD) could experience the upward support driven by the improved US Treasury yields. The US 10-year Treasury yield stands at 4.35% by the press time, below its highest level in 16 years.
The Economic Forecasts released by the Swiss State Secretariat for Economic Affairs showed that Gross Domestic Product (GDP) growth rate for the year 2023 is up at 1.3% from the previous 1.1% rate. While the forecasts showed the growth for the year 2024 has been reduced to 1.2% from the 1.5% previously.
Moreover, the Consumer Price Index (CPI) forecast figure reduced to 2.2% in the year 2023 from the previous reading of 2.3%. For 2024, the inflation rose to 1.9%, which was seen at 1.5% earlier.
US Dollar Index (DXY), which measures the performance of the US Dollar (USD) against the six other major currencies, trades sideways near 105.20 at the time of writing. Investors anticipate that the US Federal Reserve (Fed) will keep its current interest rates in September. Moreover, as per the CME FedWatch Tool, the odds of another rate hike during the November and December meetings have been reduced.
However, the market sentiment seems to suggest that the Fed is inclined to maintain higher policy rates for an extended period, a factor that could potentially strengthen the Greenback. This perception is rooted in the resilience of the US economy, characterized by a decrease in inflationary pressures and sustained growth in the labor market.
According to a Reuters report, US Treasury Secretary Janet Yellen stated on Tuesday that, it is crucial for the US to experience a slowdown in its growth rate to a level that aligns with its potential growth rate.
Yellen also mentioned “I think the Chinese would most likely use the policy space they have to try to avoid a slowdown with major proportions. There may be spillovers from China’s economic difficulties to the US.”
Fed’s “dot plots” would be significant to assess the anticipated interest rate trajectory. According to the recent Summary of Economic Projections (SEP), the median estimate from the Fed suggests that interest rates could potentially reach a peak of 5.6%.
Technical Levels: Supports and Resistances
USDCHF currently trading at 0.8972 at the time of writing. Pair opened at 0.8977 and is trading with a change of -0.06 % .
| Overview | Overview.1 | |
|---|---|---|
| 0 | Today last price | 0.8972 |
| 1 | Today Daily Change | -0.0005 |
| 2 | Today Daily Change % | -0.0600 |
| 3 | Today daily open | 0.8977 |
The pair is trading above its 20 Daily moving average @ 0.8886, above its 50 Daily moving average @ 0.8782 , above its 100 Daily moving average @ 0.8881 and below its 200 Daily moving average @ 0.9038
| Trends | Trends.1 | |
|---|---|---|
| 0 | Daily SMA20 | 0.8886 |
| 1 | Daily SMA50 | 0.8782 |
| 2 | Daily SMA100 | 0.8881 |
| 3 | Daily SMA200 | 0.9038 |
The previous day high was 0.8984 while the previous day low was 0.8948. The daily 38.2% Fib levels comes at 0.897, expected to provide support. Similarly, the daily 61.8% fib level is at 0.8962, expected to provide support.
Note the levels of interest below:
- Pivot support is noted at 0.8955, 0.8934, 0.8919
- Pivot resistance is noted at 0.8991, 0.9006, 0.9027
| Levels | Levels.1 |
|---|---|
| Previous Daily High | 0.8984 |
| Previous Daily Low | 0.8948 |
| Previous Weekly High | 0.8978 |
| Previous Weekly Low | 0.8897 |
| Previous Monthly High | 0.8876 |
| Previous Monthly Low | 0.8690 |
| Daily Fibonacci 38.2% | 0.8970 |
| Daily Fibonacci 61.8% | 0.8962 |
| Daily Pivot Point S1 | 0.8955 |
| Daily Pivot Point S2 | 0.8934 |
| Daily Pivot Point S3 | 0.8919 |
| Daily Pivot Point R1 | 0.8991 |
| Daily Pivot Point R2 | 0.9006 |
| Daily Pivot Point R3 | 0.9027 |
[/s2If]
Download Nehcap EAWe have two EAs that are operational on our LIVE accounts.
- EA-FIX: Check out the details here. Download EA-FIX . EA-FIX is a non-grid HFT scalper.
- EA-GROWTH: High quality low dd EA using trend grids. Download EA_GROWTHJoin Our Telegram Group
")


