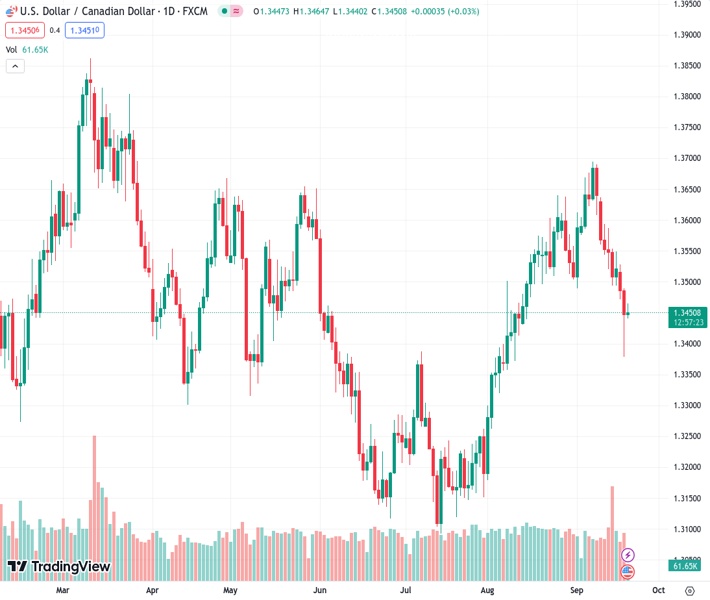
The USDCAD currency pair, currently at 1.34498, is showing a lack of clear movement and instead is fluctuating within a small range on Wednesday.
…
This is a premium post.
[s2If !current_user_can(access_s2member_level4)]Please register for FREE REGISTER to read full post below containing analysis. In case of any error or you think you are not able to read the full post below, please email us at support#nehcap.com [lwa][/s2If] [s2If current_user_can(access_s2member_level1)]
- USD/CAD lacks any firm direction and oscillates in a narrow band on Wednesday.
The pair currently trades last at 1.34498.
The previous day high was 1.349 while the previous day low was 1.3379. The daily 38.2% Fib levels comes at 1.3422, expected to provide support. Similarly, the daily 61.8% fib level is at 1.3448, expected to provide support.
The USD/CAD pair struggles to capitalize on the previous day’s late rebound from the 1.3380-1.3375 region, or its lowest level since August 10 and seesaws between tepid gains/minor losses through the early European session on Wednesday. Spot prices remain below a technically significant 200-day Simple Moving Average (SMA) and currently trade around mid-1.3400s, nearly unchanged for the day as traders keenly await the outcome of the highly-anticipated FOMC policy meeting.
The Federal Reserve (Fed) is widely expected to keep its benchmark interest rate unchanged at the current range of between 5.25% and 5.5%, though might still keep the door open for at least one more rate hike by the end of this year. The Fed is also anticipated to reiterate its stance that interest rates will remain higher for longer in the wake of the recent resurgence in US consumer inflation and signs of a resilient economy. Hence, the focus will remain glued to the accompanying policy statement and Fed Chair Jerome Powell’s comments during the post-meeting press conference. Investors will look for cues about the future rate-hike path, which, in turn, will influence the USD price dynamics and provide a fresh directional impetus to the USD/CAD pair.
Heading into the key central bank event risk, hawkish Fed expectations remain supportive of elevated US Treasury bond yields and assist the USD to hold just below a six-month peak set last week. Apart from this, retreating Crude Oil prices, from over a ten-month high touched on Tuesday, seem to undermine the commodity-linked Loonie and lend some support to the USD/CAD pair. The ongoing decline in Oil prices could be attributed to some profit-taking and is more likely to remain limited in the wake of concerns about a tight global supply, bolstered by extended production cuts announced by Saudi Arabia and Russia. Furthermore, hopes for a demand recovery in China – the world’s top Oil importer – should act as a tailwind for the black liquid.
Adding to this, reviving bets that the Bank of Canada (BoC) could hike interest rates again in the wake of a larger-than-expected jump in domestic consumer inflation could benefit the Canadian Dollar (CAD) and cap the USD/CAD pair. In fact, Statistics Canada reported on Tuesday that the headline CPI accelerated to the 4.0% YoY rate in August as compared to consensus estimates for a rise to 3.8% from 3.3% in the previous month. This might force the BoC to raise interest rates further, warranting some caution before positioning for any meaningful recovery for the major.
Technical Levels: Supports and Resistances
USDCAD currently trading at 1.3456 at the time of writing. Pair opened at 1.3448 and is trading with a change of 0.06 % .
| Overview | Overview.1 | |
|---|---|---|
| 0 | Today last price | 1.3456 |
| 1 | Today Daily Change | 0.0008 |
| 2 | Today Daily Change % | 0.0600 |
| 3 | Today daily open | 1.3448 |
The pair is trading below its 20 Daily moving average @ 1.3567, above its 50 Daily moving average @ 1.3423 , above its 100 Daily moving average @ 1.3401 and below its 200 Daily moving average @ 1.3464
| Trends | Trends.1 | |
|---|---|---|
| 0 | Daily SMA20 | 1.3567 |
| 1 | Daily SMA50 | 1.3423 |
| 2 | Daily SMA100 | 1.3401 |
| 3 | Daily SMA200 | 1.3464 |
The previous day high was 1.349 while the previous day low was 1.3379. The daily 38.2% Fib levels comes at 1.3422, expected to provide support. Similarly, the daily 61.8% fib level is at 1.3448, expected to provide support.
Note the levels of interest below:
- Pivot support is noted at 1.3388, 1.3328, 1.3277
- Pivot resistance is noted at 1.3499, 1.355, 1.361
| Levels | Levels.1 |
|---|---|
| Previous Daily High | 1.3490 |
| Previous Daily Low | 1.3379 |
| Previous Weekly High | 1.3639 |
| Previous Weekly Low | 1.3493 |
| Previous Monthly High | 1.3640 |
| Previous Monthly Low | 1.3184 |
| Daily Fibonacci 38.2% | 1.3422 |
| Daily Fibonacci 61.8% | 1.3448 |
| Daily Pivot Point S1 | 1.3388 |
| Daily Pivot Point S2 | 1.3328 |
| Daily Pivot Point S3 | 1.3277 |
| Daily Pivot Point R1 | 1.3499 |
| Daily Pivot Point R2 | 1.3550 |
| Daily Pivot Point R3 | 1.3610 |
[/s2If]
Download Nehcap EAWe have two EAs that are operational on our LIVE accounts.
- EA-FIX: Check out the details here. Download EA-FIX . EA-FIX is a non-grid HFT scalper.
- EA-GROWTH: High quality low dd EA using trend grids. Download EA_GROWTHJoin Our Telegram Group
")


