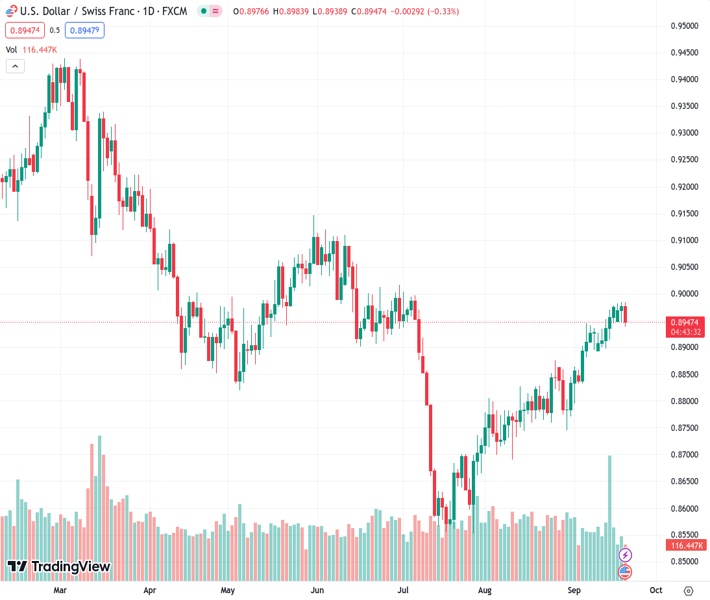
The USD/CHF currency pair fell by 0.28% during the day and reached a value of 0.8950.
…
This is a premium post.
[s2If !current_user_can(access_s2member_level4)]Please register for FREE REGISTER to read full post below containing analysis. In case of any error or you think you are not able to read the full post below, please email us at support#nehcap.com [lwa][/s2If] [s2If current_user_can(access_s2member_level1)]
- USD/CHF declined by 0.28% on the day to 0.8950.
The pair currently trades last at 0.89483.
The previous day high was 0.8984 while the previous day low was 0.8948. The daily 38.2% Fib levels comes at 0.897, expected to provide resistance. Similarly, the daily 61.8% fib level is at 0.8962, expected to provide resistance.
On Wednesday, the USD/CHF lost some ground and declined to the 0.8950 area.
The US 10-year yield, after hitting its highest level since 2007 at 4.36%, is consolidating at 4.32%. The 2 and 5-year yields are also backing down, retreating to 5.06% and 4.47%, respectively, while the US DXY index fell below 105.00 to 104.85, seeing 0.30% losses.
Regarding the Federal Reserve (Fed) decision later in the session, markets widely anticipate that the bank will hold rates steady at the 5.25%-5.50% range. However, the Fed have all the reasons to remain hawkish due to rising Oil prices and the solid economic activity seen in the US, which could exacerbate inflationary pressures.
In addition, investors will closely monitor the updated dot plots, which in the June meeting, the median rates were revised upwards to 5.6% from 5.1% in March, as they will provide clearer guidance on the next decisions. Chair Powell’s stance will also be important for markets.
According to the daily chart, the technical outlook for USD/CHF leans neutral to bearish as signs of bullish exhaustion emerge. The Relative Strength Index (RSI) points towards a potential reversal, as its positive slope above the midline weakens after being rejected by the 70.00 threshold, while the Moving Average Convergence (MACD) displays decreasing green bars. Furthermore, the pair is above the 20-day Simple Moving Average (SMA), below the 100-day SMA, but above the 200-day SMA, highlighting the continued dominance of bulls in the broader perspective.
Support levels: 0.8940, 0.8900, 0.8885.
Resistance levels: 0.8980, 0.9000, 0.9038 (200-day SMA)
Technical Levels: Supports and Resistances
USDCHF currently trading at 0.8953 at the time of writing. Pair opened at 0.8977 and is trading with a change of -0.27 % .
| Overview | Overview.1 | |
|---|---|---|
| 0 | Today last price | 0.8953 |
| 1 | Today Daily Change | -0.0024 |
| 2 | Today Daily Change % | -0.2700 |
| 3 | Today daily open | 0.8977 |
The pair is trading above its 20 Daily moving average @ 0.8886, above its 50 Daily moving average @ 0.8782 , above its 100 Daily moving average @ 0.8881 and below its 200 Daily moving average @ 0.9038
| Trends | Trends.1 | |
|---|---|---|
| 0 | Daily SMA20 | 0.8886 |
| 1 | Daily SMA50 | 0.8782 |
| 2 | Daily SMA100 | 0.8881 |
| 3 | Daily SMA200 | 0.9038 |
The previous day high was 0.8984 while the previous day low was 0.8948. The daily 38.2% Fib levels comes at 0.897, expected to provide resistance. Similarly, the daily 61.8% fib level is at 0.8962, expected to provide resistance.
Note the levels of interest below:
- Pivot support is noted at 0.8955, 0.8934, 0.8919
- Pivot resistance is noted at 0.8991, 0.9006, 0.9027
| Levels | Levels.1 |
|---|---|
| Previous Daily High | 0.8984 |
| Previous Daily Low | 0.8948 |
| Previous Weekly High | 0.8978 |
| Previous Weekly Low | 0.8897 |
| Previous Monthly High | 0.8876 |
| Previous Monthly Low | 0.8690 |
| Daily Fibonacci 38.2% | 0.8970 |
| Daily Fibonacci 61.8% | 0.8962 |
| Daily Pivot Point S1 | 0.8955 |
| Daily Pivot Point S2 | 0.8934 |
| Daily Pivot Point S3 | 0.8919 |
| Daily Pivot Point R1 | 0.8991 |
| Daily Pivot Point R2 | 0.9006 |
| Daily Pivot Point R3 | 0.9027 |
[/s2If]
Download Nehcap EAWe have two EAs that are operational on our LIVE accounts.
- EA-FIX: Check out the details here. Download EA-FIX . EA-FIX is a non-grid HFT scalper.
- EA-GROWTH: High quality low dd EA using trend grids. Download EA_GROWTHJoin Our Telegram Group
")


