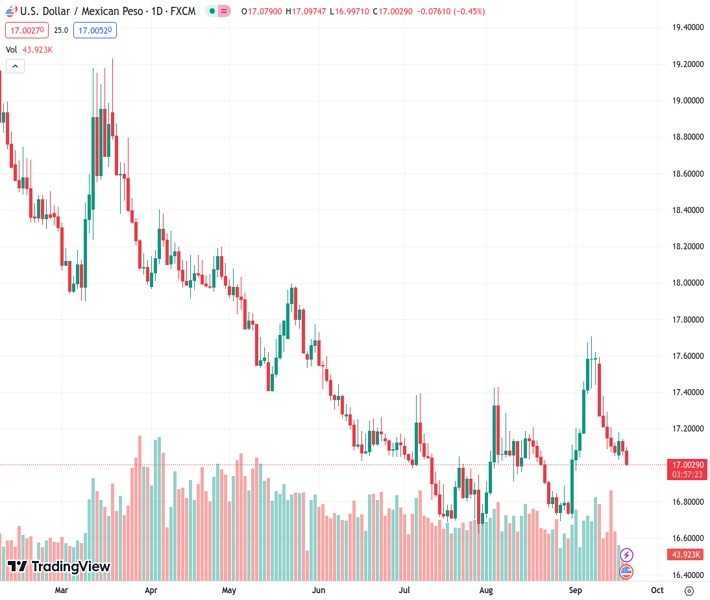
The US Dollar to Mexican Peso exchange rate is getting closer to reaching the 17.00 level, currently trading at 17.0296, while investors are eagerly anticipating signals from the Federal Reserve regarding its monetary policies.
…
This is a premium post.
[s2If !current_user_can(access_s2member_level4)]Please register for FREE REGISTER to read full post below containing analysis. In case of any error or you think you are not able to read the full post below, please email us at support#nehcap.com [lwa][/s2If] [s2If current_user_can(access_s2member_level1)]
- USD/MXN approaches the 17.00 barrier, trading at 17.0296, as traders await the Federal Reserve’s monetary policy cues.
The pair currently trades last at 16.9984.
The previous day high was 17.1424 while the previous day low was 17.0548. The daily 38.2% Fib levels comes at 17.0882, expected to provide resistance. Similarly, the daily 61.8% fib level is at 17.1089, expected to provide resistance.
The Mexican Peso (MXN) stages a comeback and appreciates against the US Dollar (USD) as traders remain on the sidelines with the Federal Reserve’s monetary policy decision looming. Although speculations for additional tightening remain, the USD/MXN pair approached the psychological 17.00 barrier, exchanging hands at around 17.0000 after hitting a daily high of 17.0974.
The market sentiment is downbeat, as seen by US equities. US Treasury bond yields are dropping, a headwind for the US Dollar (USD). The Federal Reserve is expected to keep rates unchanged at the 5.25%-5.50% range and deliver a hawkish message. At the same time, its officials would update their economic projections, including the Federal Funds Rate (FFR) for the remainder of the year, 2024 and 2025. A downward revision to the FFR would be considered dovish, weakening the Greenback.
The money market futures show the Fed’s odds for a November rate hike are at 27% for a quarter of a percent increase, ahead of the Federal Open Market Committee (FOMC) decision. For December, the odds stand at 34.1%.
The US Dollar Index, a gauge of the buck’s value vs. a basket of six currencies, drops 0.39% and sits at 104.80, weighing on the USD/MXN pair.
Aside from this, a scarce Mexican economic docket has not been an excuse for USD/MXN sellers to step in an boost the emerging market currency. Tomorrow, the Instituto Nacional de Estadistica Geografia e Informatica (INEGI) will release Retail Sales data and Mexican Inflation on Friday.
Given the current interest rate differential between Mexico and the US favors the former, we could expect further downside in the USD/MXN.
From a technical perspective, the break below 17.0000 could pave the way for further downside, but the 50-day Moving Average (DMA) at 17.0123 is holding the fort for USD/MXN buyers. Once cleared, the next stop would be the August 28 swing low of 16.6923. On the flip side, if the pair jumps and reclaims the September 18 high of 17.1812, that would pave the way for a recovery towards the 100-DMA at 17.2007.
Technical Levels: Supports and Resistances
USDMXN currently trading at 17.0086 at the time of writing. Pair opened at 17.0817 and is trading with a change of -0.43 % .
| Overview | Overview.1 | |
|---|---|---|
| 0 | Today last price | 17.0086 |
| 1 | Today Daily Change | -0.0731 |
| 2 | Today Daily Change % | -0.4300 |
| 3 | Today daily open | 17.0817 |
The pair remains strongly bearish on the daily time frame. It trades below the 20 SMA @ 17.1131, 50 SMA 17.0175, 100 SMA @ 17.2163 and 200 SMA @ 17.9303.
| Trends | Trends.1 | |
|---|---|---|
| 0 | Daily SMA20 | 17.1131 |
| 1 | Daily SMA50 | 17.0175 |
| 2 | Daily SMA100 | 17.2163 |
| 3 | Daily SMA200 | 17.9303 |
The previous day high was 17.1424 while the previous day low was 17.0548. The daily 38.2% Fib levels comes at 17.0882, expected to provide resistance. Similarly, the daily 61.8% fib level is at 17.1089, expected to provide resistance.
Note the levels of interest below:
- Pivot support is noted at 17.0435, 17.0054, 16.956
- Pivot resistance is noted at 17.1311, 17.1805, 17.2187
| Levels | Levels.1 |
|---|---|
| Previous Daily High | 17.1424 |
| Previous Daily Low | 17.0548 |
| Previous Weekly High | 17.5959 |
| Previous Weekly Low | 17.0504 |
| Previous Monthly High | 17.4274 |
| Previous Monthly Low | 16.6945 |
| Daily Fibonacci 38.2% | 17.0882 |
| Daily Fibonacci 61.8% | 17.1089 |
| Daily Pivot Point S1 | 17.0435 |
| Daily Pivot Point S2 | 17.0054 |
| Daily Pivot Point S3 | 16.9560 |
| Daily Pivot Point R1 | 17.1311 |
| Daily Pivot Point R2 | 17.1805 |
| Daily Pivot Point R3 | 17.2187 |
[/s2If]
Download Nehcap EAWe have two EAs that are operational on our LIVE accounts.
- EA-FIX: Check out the details here. Download EA-FIX . EA-FIX is a non-grid HFT scalper.
- EA-GROWTH: High quality low dd EA using trend grids. Download EA_GROWTHJoin Our Telegram Group
")


