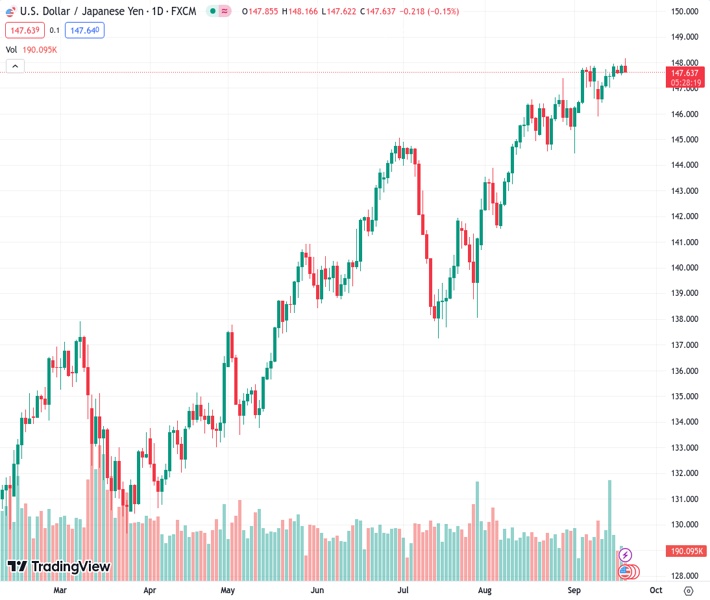
The currency pair USDJPY is currently being traded at 147.75, slightly below its year-to-date high of 147.647. Traders are exercising caution as they anticipate the monetary policy decision from the Federal Reserve.
…
This is a premium post.
[s2If !current_user_can(access_s2member_level4)]Please register for FREE REGISTER to read full post below containing analysis. In case of any error or you think you are not able to read the full post below, please email us at support#nehcap.com [lwa][/s2If] [s2If current_user_can(access_s2member_level1)]
- USD/JPY trades cautiously at 147.75, just off its YTD high, as traders await the Fed’s monetary policy decision.
The pair currently trades last at 147.647.
The previous day high was 147.92 while the previous day low was 147.51. The daily 38.2% Fib levels comes at 147.76, expected to provide resistance. Similarly, the daily 61.8% fib level is at 147.67, expected to provide resistance.
The USD/JPY remains subdued early in the North American session as traders brace for the US Federal Reserve’s monetary policy decision. Also, risks of an intervention by Japanese authorities in the Forex markets refrain buyers from opening fresh positions. At the time of writing, the pair exchanges hands at 147.75 after printing a new year-to-date (YTD) high of 148.16
USD/JPY price action remains flat, with traders waiting for Fed Chair Jerome Powell and Co. The markets expect a hawkish hold by the Fed, though the Greenback (USD) remains pressured, as shown by the US Dollar Index (DXY) at 104.82, dropping 0.36%. One reason behind the move is US Treasury bond yields, which are dropping, after hitting multi-year highs on Tuesday.
Besides delivering its rate decision, the Fed would update its economic projections for the rest of the year and 2024 and 2025. Investors must be keen to scrutinize their economic forecasts, which could add more volatility besides the headline. Downward revisions for the Federal Fund Rates (FFR) could be seen as a dovish reaction by the central bank. Meanwhile, keeping them unchanged could add to the mantra of maintaining rates “higher for longer.”
Aside from this theme, investors’ fear of a “possible” intervention by Japanese authorities is gaining traction. US Treasury Secretary Janet Yellen said she could understand Japanese authorities’ currency intervention if it was to control volatility.
In the meantime, a former Vice Minister of Finance for International Affairs in Japan, Takehiko Nakao, said the Bank of Japan should ditch its ultra-loose monetary policy and that Japan could intervene in the FX markets to support the Yen.
From a technical perspective, the USD/JPY is at the brisk of conquering 148.00 and extends its gains towards the October 31 daily high of 148.84, which, if cleared, the USD/JPY could re-test the 150.00 mark. Nevertheless, traders remain cautious of a possible intervention. On the downside, a drop below the September 20 low of 147.62 could pave the way to test the Tenkan-Sen at 147.03. Additional support levels emerge below the latter, with the Senkou Span A at 146.66 and the Kijun-Sen at 146.30.
Technical Levels: Supports and Resistances
USDJPY currently trading at 147.66 at the time of writing. Pair opened at 147.86 and is trading with a change of -0.14 % .
| Overview | Overview.1 | |
|---|---|---|
| 0 | Today last price | 147.66 |
| 1 | Today Daily Change | -0.20 |
| 2 | Today Daily Change % | -0.14 |
| 3 | Today daily open | 147.86 |
The pair remains strongly bullish on the daily timeframe. It trades above its 20 SMA @ 146.82, 50 SMA 144.15, 100 SMA @ 142.03 and 200 SMA @ 137.46.
| Trends | Trends.1 | |
|---|---|---|
| 0 | Daily SMA20 | 146.82 |
| 1 | Daily SMA50 | 144.15 |
| 2 | Daily SMA100 | 142.03 |
| 3 | Daily SMA200 | 137.46 |
The previous day high was 147.92 while the previous day low was 147.51. The daily 38.2% Fib levels comes at 147.76, expected to provide resistance. Similarly, the daily 61.8% fib level is at 147.67, expected to provide resistance.
Note the levels of interest below:
- Pivot support is noted at 147.61, 147.35, 147.19
- Pivot resistance is noted at 148.02, 148.18, 148.43
| Levels | Levels.1 |
|---|---|
| Previous Daily High | 147.92 |
| Previous Daily Low | 147.51 |
| Previous Weekly High | 147.95 |
| Previous Weekly Low | 145.90 |
| Previous Monthly High | 147.38 |
| Previous Monthly Low | 141.51 |
| Daily Fibonacci 38.2% | 147.76 |
| Daily Fibonacci 61.8% | 147.67 |
| Daily Pivot Point S1 | 147.61 |
| Daily Pivot Point S2 | 147.35 |
| Daily Pivot Point S3 | 147.19 |
| Daily Pivot Point R1 | 148.02 |
| Daily Pivot Point R2 | 148.18 |
| Daily Pivot Point R3 | 148.43 |
[/s2If]
Download Nehcap EAWe have two EAs that are operational on our LIVE accounts.
- EA-FIX: Check out the details here. Download EA-FIX . EA-FIX is a non-grid HFT scalper.
- EA-GROWTH: High quality low dd EA using trend grids. Download EA_GROWTHJoin Our Telegram Group
")


