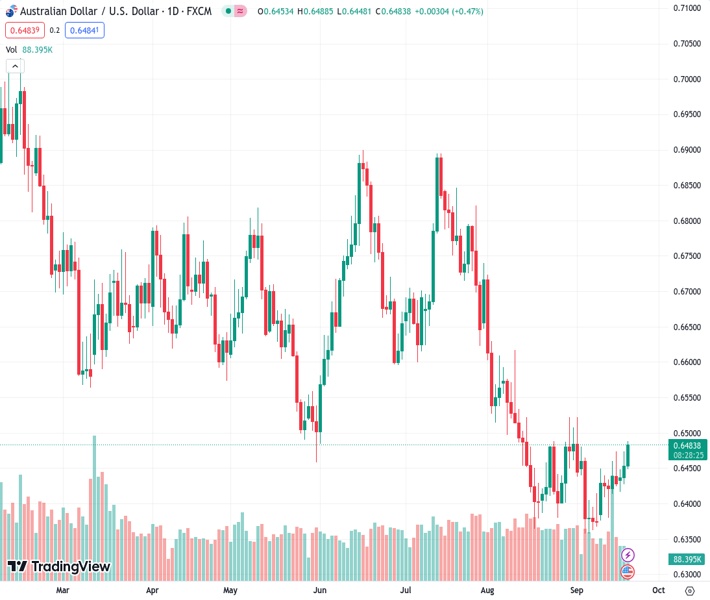
The Australian dollar to US dollar exchange rate, currently at 0.64860, experiences a slight increase close to 0.6500 as the People’s Bank of China continues to follow a cautious approach towards interest rates.
…
This is a premium post.
[s2If !current_user_can(access_s2member_level4)]Please register for FREE REGISTER to read full post below containing analysis. In case of any error or you think you are not able to read the full post below, please email us at support#nehcap.com [lwa][/s2If] [s2If current_user_can(access_s2member_level1)]
- AUD/USD rallies to near 0.6500 as the PBoC maintains a dovish interest rate policy.
The pair currently trades last at 0.64860.
The previous day high was 0.6474 while the previous day low was 0.6428. The daily 38.2% Fib levels comes at 0.6456, expected to provide support. Similarly, the daily 61.8% fib level is at 0.6445, expected to provide support.
The AUD/USD pair delivered a rally to near the psychological resistance of 0.6500 in the late European session. The Aussie asset picked strength after the People’s Bank of China (PBOC) kept its one-year and five-year Loan Prime Rate (LPR) unchanged at 3.45% and 4.20% respectively.
The PBoC was expected to maintain a dovish interest rate policy as the Chinese economy is under pressure due to upside deflation risks. Further policy expansion would support the economy to find footing amid a bleak economic outlook.
Meanwhile, the show-stopper event for the FX domain is the interest rate decision by the Federal Reserve (Fed). The US central bank is expected to keep interest rates unchanged at 5.25-5.50%. As the US inflation has been consistently falling while maintaining economic resilience, the Fed has the opportunity to skip the policy tightening regime for the second time in its current tightening cycle.
AUD/USD rebounds after discovering buying interest near the horizontal support plotted from August 17 low around 0.6364 on a two-hour scale. The Aussie asset stabilizes above the 20-day Exponential Moving Average (EMA), which trades around 0.6340. Potential resistance is plotted from August 15 high at 0.6522.
The Relative Strength Index (RSI) (14) jumps above 60.0, which indicates that the bullish impulse has been triggered.
A decisive break above August 15 high around 0.6522 will drive the asset to August 9 high at 0.6571. Breach of the latter will drive the asset towards August 10 high at 0.6616.
On the flip side, fresh downside would appear if the Aussie asset will drop below August 17 low around 0.6360. This would expose the asset to the round-level support of 0.6300 followed by 03 November 2022 low at 0.6272.
Technical Levels: Supports and Resistances
AUDUSD currently trading at 0.6484 at the time of writing. Pair opened at 0.6454 and is trading with a change of 0.46 % .
| Overview | Overview.1 | |
|---|---|---|
| 0 | Today last price | 0.6484 |
| 1 | Today Daily Change | 0.0030 |
| 2 | Today Daily Change % | 0.4600 |
| 3 | Today daily open | 0.6454 |
The pair is trading above its 20 Daily moving average @ 0.6432, below its 50 Daily moving average @ 0.6547 , below its 100 Daily moving average @ 0.6613 and below its 200 Daily moving average @ 0.6701
| Trends | Trends.1 | |
|---|---|---|
| 0 | Daily SMA20 | 0.6432 |
| 1 | Daily SMA50 | 0.6547 |
| 2 | Daily SMA100 | 0.6613 |
| 3 | Daily SMA200 | 0.6701 |
The previous day high was 0.6474 while the previous day low was 0.6428. The daily 38.2% Fib levels comes at 0.6456, expected to provide support. Similarly, the daily 61.8% fib level is at 0.6445, expected to provide support.
Note the levels of interest below:
- Pivot support is noted at 0.643, 0.6406, 0.6384
- Pivot resistance is noted at 0.6476, 0.6498, 0.6522
| Levels | Levels.1 |
|---|---|
| Previous Daily High | 0.6474 |
| Previous Daily Low | 0.6428 |
| Previous Weekly High | 0.6474 |
| Previous Weekly Low | 0.6378 |
| Previous Monthly High | 0.6724 |
| Previous Monthly Low | 0.6364 |
| Daily Fibonacci 38.2% | 0.6456 |
| Daily Fibonacci 61.8% | 0.6445 |
| Daily Pivot Point S1 | 0.6430 |
| Daily Pivot Point S2 | 0.6406 |
| Daily Pivot Point S3 | 0.6384 |
| Daily Pivot Point R1 | 0.6476 |
| Daily Pivot Point R2 | 0.6498 |
| Daily Pivot Point R3 | 0.6522 |
[/s2If]
Download Nehcap EAWe have two EAs that are operational on our LIVE accounts.
- EA-FIX: Check out the details here. Download EA-FIX . EA-FIX is a non-grid HFT scalper.
- EA-GROWTH: High quality low dd EA using trend grids. Download EA_GROWTHJoin Our Telegram Group
")


