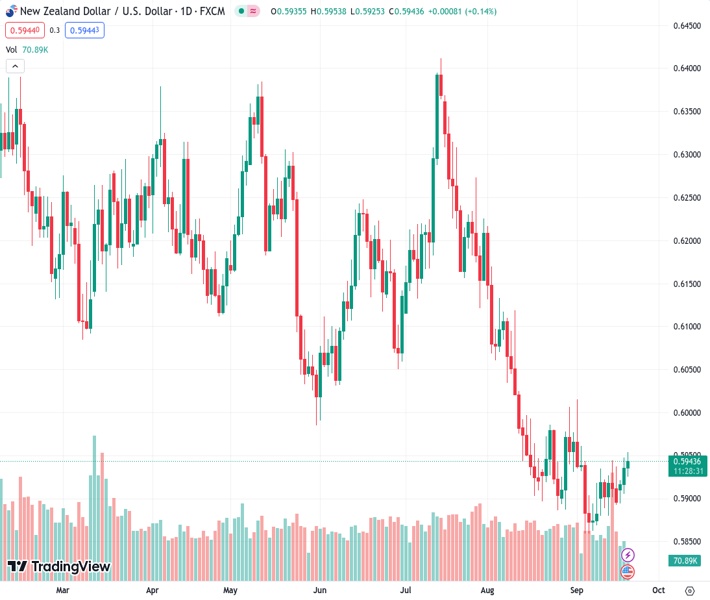
Strength is being accumulated by NZDUSD at a level of 0.59419, in preparation for a potential breakout of the ascending triangle pattern. This breakout is anticipated to occur prior to the announcement of the Federal Reserve’s monetary policy.
…
This is a premium post.
[s2If !current_user_can(access_s2member_level4)]Please register for FREE REGISTER to read full post below containing analysis. In case of any error or you think you are not able to read the full post below, please email us at support#nehcap.com [lwa][/s2If] [s2If current_user_can(access_s2member_level1)]
- NZD/USD gathers strength for an ascending triangle pattern breakout ahead of Fed policy.
The pair currently trades last at 0.59419.
The previous day high was 0.5948 while the previous day low was 0.5904. The daily 38.2% Fib levels comes at 0.5931, expected to provide support. Similarly, the daily 61.8% fib level is at 0.5921, expected to provide support.
The NZD/USD pair trades sideways in a narrow range of 0.5932-0.5944 in the European session. The Kiwi asset struggles for a direction as investors await the interest rate decision from the Federal Reserve (Fed), which is expected to remain unchanged.
S&P500 futures generated marginal gains in the London session. However, the overall market mood is quiet ahead of the Fed policy meeting. The US Dollar Index (DXY) remains subdued as the Fed is expected to keep interest rates unchanged at 5.25-5.50% but hawkish guidance cannot be ruled out.
Meanwhile, the New Zealand Dollar will remain in action ahead of the q2 Gross Domestic Product (GDP) data. As per the expectations, the NZ economy grew by 0.5% vs. a contraction of 0.1%, being recorded for the January-March quarter. The annual GDP is seen accelerating at a slower pace of 1.2% vs. the former reading of 2.2%.
NZD/USD attempts to deliver a breakout of the Ascending Triangle chart pattern formed on a two-hour scale. The horizontal resistance of the aforementioned chart pattern is plotted from September 6 high at 0.5942 while the upward-sloping trendline is placed from September 7 low at 0.5847.
The 20-period Exponential Moving Average (EMA) at 0.5932 is providing a cushion to the New Zealand Dollar.
Meanwhile, the Relative Strength Index (RSI) (14) attempts to shift into the bullish range of 60.00-80.00. If the RSI (14) manages to do so, a bullish momentum will get triggered.
Going forward, a decisive break above September 14 high at 0.5945 would expose the asset to August 23 high around 0.5980, followed by August 8 low around 0.6035.
On the contrary, a breakdown below September 13 low at 0.5980 would drag the major toward September 7 low at 0.5847. A slippage below the latter would expose the asset to the round-level support at 0.5800.
Technical Levels: Supports and Resistances
NZDUSD currently trading at 0.5942 at the time of writing. Pair opened at 0.5936 and is trading with a change of 0.1 % .
| Overview | Overview.1 | |
|---|---|---|
| 0 | Today last price | 0.5942 |
| 1 | Today Daily Change | 0.0006 |
| 2 | Today Daily Change % | 0.1000 |
| 3 | Today daily open | 0.5936 |
The pair is trading above its 20 Daily moving average @ 0.5921, below its 50 Daily moving average @ 0.6043 , below its 100 Daily moving average @ 0.6106 and below its 200 Daily moving average @ 0.6195
| Trends | Trends.1 | |
|---|---|---|
| 0 | Daily SMA20 | 0.5921 |
| 1 | Daily SMA50 | 0.6043 |
| 2 | Daily SMA100 | 0.6106 |
| 3 | Daily SMA200 | 0.6195 |
The previous day high was 0.5948 while the previous day low was 0.5904. The daily 38.2% Fib levels comes at 0.5931, expected to provide support. Similarly, the daily 61.8% fib level is at 0.5921, expected to provide support.
Note the levels of interest below:
- Pivot support is noted at 0.5911, 0.5886, 0.5868
- Pivot resistance is noted at 0.5955, 0.5973, 0.5998
| Levels | Levels.1 |
|---|---|
| Previous Daily High | 0.5948 |
| Previous Daily Low | 0.5904 |
| Previous Weekly High | 0.5945 |
| Previous Weekly Low | 0.5880 |
| Previous Monthly High | 0.6219 |
| Previous Monthly Low | 0.5885 |
| Daily Fibonacci 38.2% | 0.5931 |
| Daily Fibonacci 61.8% | 0.5921 |
| Daily Pivot Point S1 | 0.5911 |
| Daily Pivot Point S2 | 0.5886 |
| Daily Pivot Point S3 | 0.5868 |
| Daily Pivot Point R1 | 0.5955 |
| Daily Pivot Point R2 | 0.5973 |
| Daily Pivot Point R3 | 0.5998 |
[/s2If]
Download Nehcap EAWe have two EAs that are operational on our LIVE accounts.
- EA-FIX: Check out the details here. Download EA-FIX . EA-FIX is a non-grid HFT scalper.
- EA-GROWTH: High quality low dd EA using trend grids. Download EA_GROWTHJoin Our Telegram Group
")


