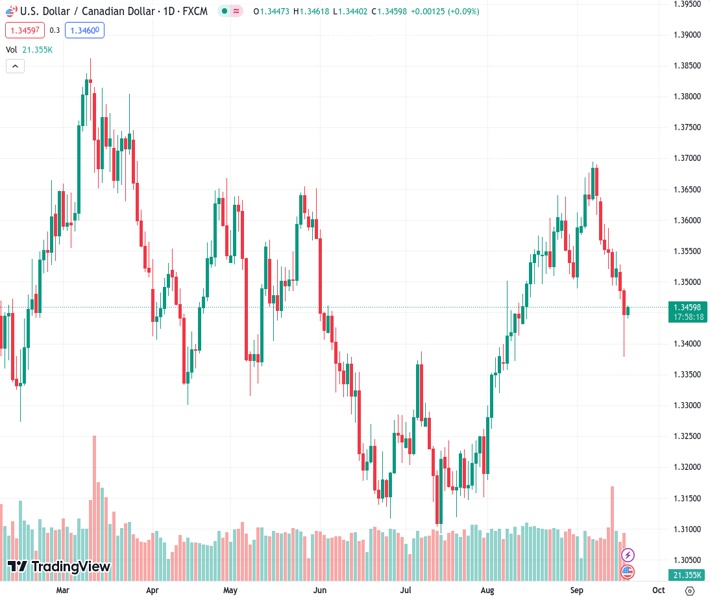
Before the Federal Reserve policy decision, the USDCAD currency pair is rebounding from its recent decline.
…
This is a premium post.
[s2If !current_user_can(access_s2member_level4)]Please register for FREE REGISTER to read full post below containing analysis. In case of any error or you think you are not able to read the full post below, please email us at support#nehcap.com [lwa][/s2If] [s2If current_user_can(access_s2member_level1)]
- USD/CAD retraces the recent losses ahead of the Fed policy decision.
The pair currently trades last at 1.34607.
The previous day high was 1.349 while the previous day low was 1.3379. The daily 38.2% Fib levels comes at 1.3422, expected to provide support. Similarly, the daily 61.8% fib level is at 1.3448, expected to provide support.
USD/CAD trades higher around 1.3450 during the Asian session on Wednesday, snapping the two-day losing streak. The pair is under pressure after Canada’s upbeat inflation data was released on Tuesday.
Canada’s Consumer Price Index (CPI) for the year-over-year period in August increased to a rate of 4.0%, surpassing market expectations of 3.8% and the previous reading of 3.3%. However, the CPI (MoM) rose by 0.4%, slightly lower than the 0.6% reported previously but still exceeding market expectations of 0.2%.
BoC Consumer Price Index Core (YoY) report printed the rate of 3.3%, which exceeds the previous 3.2% rate.
Additionally, the surge in Crude oil prices is bolstering the Canadian Dollar (CAD). The concerns over global supply reduction lead to oil costs higher. WTI price trades around $89.90 at the time of writing.
The Energy Information Agency (EIA) warns that US shale production is expected to decrease further in October. According to the EIA’s Drilling Productivity Report, shale production is projected to reach 9.393 million barrels per day (bpd), which is the lowest level since May of this year.
US Dollar Index (DXY) experienced a seesaw during the American session on Tuesday. The deterioration in market sentiment and higher US Treasury yields propelled the DXY to initially drop to 104.80 but then quickly rebounded above the 105.00 level once more.
DXY treads waters above 105.10 at the time of writing, reinforced by higher US Treasury bond yields. The yield on the US 10-year Treasury note stands at 4.36% by the press time, below its highest level in 16 years.
Market sentiment appears to be the US Federal Reserve (Fed) maintaining interest rates within the existing 5.25%-5.50% range in September. This stance could potentially exert pressure on the US Dollar (USD). According to the CME FedWatch Tool, the likelihood of another rate hike during the November and December meetings has been reduced.
However, the Greenback may find support in the ongoing possibility of maintaining higher policy rates over an extended period. This is attributed to the resilience of the US economy, marked by a decrease in inflationary pressures and consistent labor market growth.
According to a Reuters report, US Treasury Secretary Janet Yellen stated on Tuesday that, as the economy is operating at full employment, it’s essential for US growth to slow down to a pace that aligns with its potential growth rate in order to bring inflation back to target levels.
Yellen also said “I think the Chinese would most likely use the policy space they have to try to avoid a slowdown with major proportions. There may be spillovers from China’s economic difficulties to the US.”
Market participants will also closely focus on the “dot plots” to evaluate the anticipated interest rate path. According to the most recent Summary of Economic Projections (SEP), the median estimate from the Federal Reserve suggests that interest rates could potentially reach a peak of 5.6%.
Technical Levels: Supports and Resistances
USDCAD currently trading at 1.3457 at the time of writing. Pair opened at 1.3448 and is trading with a change of 0.07 % .
| Overview | Overview.1 | |
|---|---|---|
| 0 | Today last price | 1.3457 |
| 1 | Today Daily Change | 0.0009 |
| 2 | Today Daily Change % | 0.0700 |
| 3 | Today daily open | 1.3448 |
The pair is trading below its 20 Daily moving average @ 1.3567, above its 50 Daily moving average @ 1.3423 , above its 100 Daily moving average @ 1.3401 and below its 200 Daily moving average @ 1.3464
| Trends | Trends.1 | |
|---|---|---|
| 0 | Daily SMA20 | 1.3567 |
| 1 | Daily SMA50 | 1.3423 |
| 2 | Daily SMA100 | 1.3401 |
| 3 | Daily SMA200 | 1.3464 |
The previous day high was 1.349 while the previous day low was 1.3379. The daily 38.2% Fib levels comes at 1.3422, expected to provide support. Similarly, the daily 61.8% fib level is at 1.3448, expected to provide support.
Note the levels of interest below:
- Pivot support is noted at 1.3388, 1.3328, 1.3277
- Pivot resistance is noted at 1.3499, 1.355, 1.361
| Levels | Levels.1 |
|---|---|
| Previous Daily High | 1.3490 |
| Previous Daily Low | 1.3379 |
| Previous Weekly High | 1.3639 |
| Previous Weekly Low | 1.3493 |
| Previous Monthly High | 1.3640 |
| Previous Monthly Low | 1.3184 |
| Daily Fibonacci 38.2% | 1.3422 |
| Daily Fibonacci 61.8% | 1.3448 |
| Daily Pivot Point S1 | 1.3388 |
| Daily Pivot Point S2 | 1.3328 |
| Daily Pivot Point S3 | 1.3277 |
| Daily Pivot Point R1 | 1.3499 |
| Daily Pivot Point R2 | 1.3550 |
| Daily Pivot Point R3 | 1.3610 |
[/s2If]
Download Nehcap EAWe have two EAs that are operational on our LIVE accounts.
- EA-FIX: Check out the details here. Download EA-FIX . EA-FIX is a non-grid HFT scalper.
- EA-GROWTH: High quality low dd EA using trend grids. Download EA_GROWTHJoin Our Telegram Group
")


