The USDCAD pair, currently at a rate of 1.34451, is making an effort to regain the value it lost earlier in the day.
…
This is a premium post.
[s2If !current_user_can(access_s2member_level4)]Please register for FREE REGISTER to read full post below containing analysis. In case of any error or you think you are not able to read the full post below, please email us at support#nehcap.com [lwa][/s2If] [s2If current_user_can(access_s2member_level1)]
- The USD/CAD is trying to recover the day’s losses after getting knocked lower.
The pair currently trades last at 1.34451.
The previous day high was 1.3528 while the previous day low was 1.3472. The daily 38.2% Fib levels comes at 1.3493, expected to provide resistance. Similarly, the daily 61.8% fib level is at 1.3507, expected to provide resistance.
The USD/CAD started Tuesday in freefall, declining from the day’s open near 1.3480 and tapping into 1.3380. Rising oil prices are bolstering the Loonie (CAD), as concerns over global supply constraints knock crude barrel costs into the ceiling.
Despite the Loonie-led dip, the USD/CAD is recovering into the middle ground. Greenback (USD) traders are keeping light on their feet as the next showing from the Federal Reserve (Fed) rounds the corner.
The Fed’s latest rate call will be dropping on markets on Wednesday, with the Fed’s rate call and ensuing press conference scheduled for 18:00 GMT tomorrow.
The Fed is broadly expected to stand pat on rates for the time being, holding benchmark rates at 5.5%. The Federal Open Market Committee (FOMC) will also be publishing their economic projections and inflation outlook figures, something that investors will be scrambling to process.
It’s a light economic calendar week for the CAD, and market momentum will be firmly in the hands of crude oil and Greenback traders.
The USD/CAD is drifting into the middle in late Tuesday trading, testing the waters near 1.3450 after the early session’s fast drop.
The pair declined 0.72% from Tuesday’s opening prices near 1.3475, but the mid-day recovery sees the pair nearing the 68% retracement of the day’s drop.
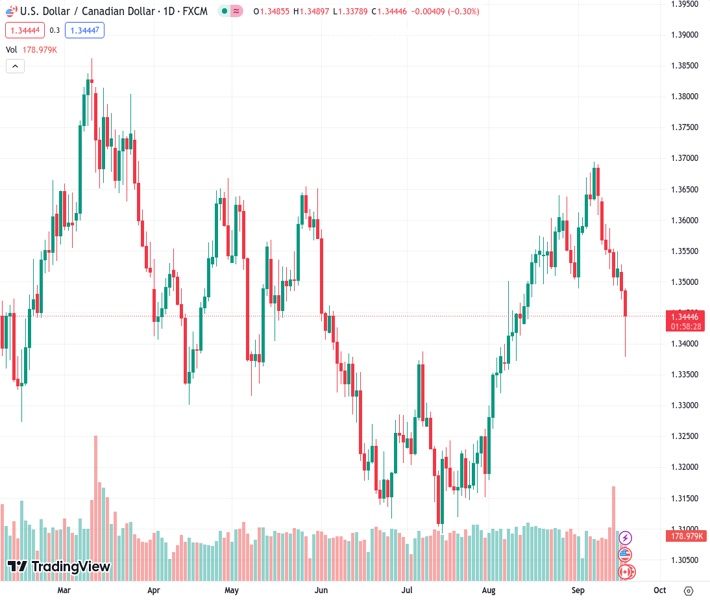
Rapidly increasing crude prices has sent the USD/CAD lower on the daily candlesticks, with the pair set to close in the red for seven of the last eight consecutive trading days.
The Dollar-Loonie pair has slid past the 200-day Simple Moving Average (SMA) in Tuesday’s trading. Continued selling pressure will see the pair challenging the last swing low near 1.3100, while an upside recovery will have to reclaim the 1.3700 handle to establish a determined uptrend.
Technical Levels: Supports and Resistances
USDCAD currently trading at 1.3441 at the time of writing. Pair opened at 1.3486 and is trading with a change of -0.33 % .
| Overview | Overview.1 | |
|---|---|---|
| 0 | Today last price | 1.3441 |
| 1 | Today Daily Change | -0.0045 |
| 2 | Today Daily Change % | -0.3300 |
| 3 | Today daily open | 1.3486 |
The pair is trading below its 20 Daily moving average @ 1.3572, above its 50 Daily moving average @ 1.3418 , above its 100 Daily moving average @ 1.3402 and below its 200 Daily moving average @ 1.3464
| Trends | Trends.1 | |
|---|---|---|
| 0 | Daily SMA20 | 1.3572 |
| 1 | Daily SMA50 | 1.3418 |
| 2 | Daily SMA100 | 1.3402 |
| 3 | Daily SMA200 | 1.3464 |
The previous day high was 1.3528 while the previous day low was 1.3472. The daily 38.2% Fib levels comes at 1.3493, expected to provide resistance. Similarly, the daily 61.8% fib level is at 1.3507, expected to provide resistance.
Note the levels of interest below:
- Pivot support is noted at 1.3463, 1.3439, 1.3406
- Pivot resistance is noted at 1.3519, 1.3552, 1.3576
| Levels | Levels.1 |
|---|---|
| Previous Daily High | 1.3528 |
| Previous Daily Low | 1.3472 |
| Previous Weekly High | 1.3639 |
| Previous Weekly Low | 1.3493 |
| Previous Monthly High | 1.3640 |
| Previous Monthly Low | 1.3184 |
| Daily Fibonacci 38.2% | 1.3493 |
| Daily Fibonacci 61.8% | 1.3507 |
| Daily Pivot Point S1 | 1.3463 |
| Daily Pivot Point S2 | 1.3439 |
| Daily Pivot Point S3 | 1.3406 |
| Daily Pivot Point R1 | 1.3519 |
| Daily Pivot Point R2 | 1.3552 |
| Daily Pivot Point R3 | 1.3576 |
[/s2If]
Download Nehcap EAWe have two EAs that are operational on our LIVE accounts.
- EA-FIX: Check out the details here. Download EA-FIX . EA-FIX is a non-grid HFT scalper.
- EA-GROWTH: High quality low dd EA using trend grids. Download EA_GROWTHJoin Our Telegram Group
")


