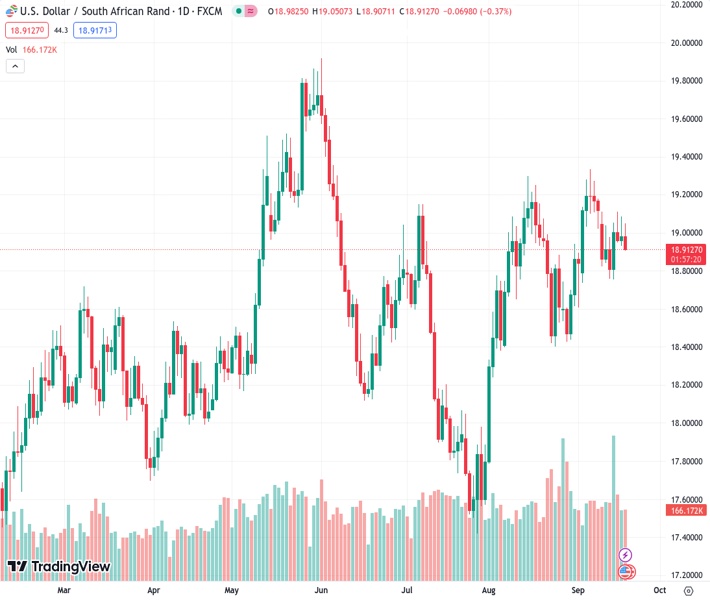
The USD/ZAR currency pair dropped to approximately 18.933, which is in close proximity to the 20-day Simple Moving Average (SMA).
…
This is a premium post.
[s2If !current_user_can(access_s2member_level4)]Please register for FREE REGISTER to read full post below containing analysis. In case of any error or you think you are not able to read the full post below, please email us at support#nehcap.com [lwa][/s2If] [s2If current_user_can(access_s2member_level1)]
- USD/ZAR declined towards 18.933, near the 20-day SMA.
The pair currently trades last at 18.9173.
The previous day high was 19.0902 while the previous day low was 18.9346. The daily 38.2% Fib levels comes at 18.9941, expected to provide resistance. Similarly, the daily 61.8% fib level is at 19.0308, expected to provide resistance.
In Tuesday’s session, the USD/ZAR faced some selling pressure and declined to 18.933, down by 0.25%, and seems to be on its way to retest the 20-day Simple Moving Average at 18.880.
All eyes are on Wednesday. South Africa reports the August Consumer Price Index (CPI) with the headline figure expected to increase slightly to 4.8% YoY, while the core inflation rate is anticipated to remain stable at 4.7% YoY. Retail Sales from July are expected to come in at -1.0% YoY, compared to the 0.9% YoY decrease in June. Regarding the South African Reserve Bank meeting on Thursday, the decision will likely be to maintain its interest rates at 8.25% despite some previous expectations of a hike. As for now, for the next twelve years, markets aren’t foreseeing any hikes and discounts that the bank will maintain rates at 8.25%.
On the Fed’s side, Markets expect the bank to keep rates steady at 5.25-5.50%, but Chair Powell will likely show a hawkish tone and signal future rate hikes which could benefit the USD. Strong US economic performance, especially in services, and a mixed labour market suggest the Fed may leave room for one more hike to curb inflation risks.
The daily chart shows signs of bullish exhaustion for USD/ZAR. The Relative Strength Index (RSI) indicates a neutral stance above its midline, displaying a flat slope in the positive territory, while the Moving Average Convergence (MACD) presents neutral red bars. On the bigger picture, the pair is above the 20,100,200-day Simple Moving Average (SMA), suggesting that the bears are struggling to challenge the overall bullish trend.
Support levels: 18.880 (20-day SMA), 18.728 (100-day SMA). 18.500.
Resistance levels: 19.000, 19.050, 19.150.
Technical Levels: Supports and Resistances
USDZAR currently trading at 18.933 at the time of writing. Pair opened at 19.0018 and is trading with a change of -0.36 % .
| Overview | Overview.1 | |
|---|---|---|
| 0 | Today last price | 18.9330 |
| 1 | Today Daily Change | -0.0688 |
| 2 | Today Daily Change % | -0.3600 |
| 3 | Today daily open | 19.0018 |
The pair remains strongly bullish on the daily timeframe. It trades above its 20 SMA @ 18.8827, 50 SMA 18.5785, 100 SMA @ 18.7397 and 200 SMA @ 18.2589.
| Trends | Trends.1 | |
|---|---|---|
| 0 | Daily SMA20 | 18.8827 |
| 1 | Daily SMA50 | 18.5785 |
| 2 | Daily SMA100 | 18.7397 |
| 3 | Daily SMA200 | 18.2589 |
The previous day high was 19.0902 while the previous day low was 18.9346. The daily 38.2% Fib levels comes at 18.9941, expected to provide resistance. Similarly, the daily 61.8% fib level is at 19.0308, expected to provide resistance.
Note the levels of interest below:
- Pivot support is noted at 18.9275, 18.8533, 18.7719
- Pivot resistance is noted at 19.0831, 19.1645, 19.2387
| Levels | Levels.1 |
|---|---|
| Previous Daily High | 19.0902 |
| Previous Daily Low | 18.9346 |
| Previous Weekly High | 19.1283 |
| Previous Weekly Low | 18.7634 |
| Previous Monthly High | 19.2985 |
| Previous Monthly Low | 17.8264 |
| Daily Fibonacci 38.2% | 18.9941 |
| Daily Fibonacci 61.8% | 19.0308 |
| Daily Pivot Point S1 | 18.9275 |
| Daily Pivot Point S2 | 18.8533 |
| Daily Pivot Point S3 | 18.7719 |
| Daily Pivot Point R1 | 19.0831 |
| Daily Pivot Point R2 | 19.1645 |
| Daily Pivot Point R3 | 19.2387 |
[/s2If]
Download Nehcap EAWe have two EAs that are operational on our LIVE accounts.
- EA-FIX: Check out the details here. Download EA-FIX . EA-FIX is a non-grid HFT scalper.
- EA-GROWTH: High quality low dd EA using trend grids. Download EA_GROWTHJoin Our Telegram Group
")


