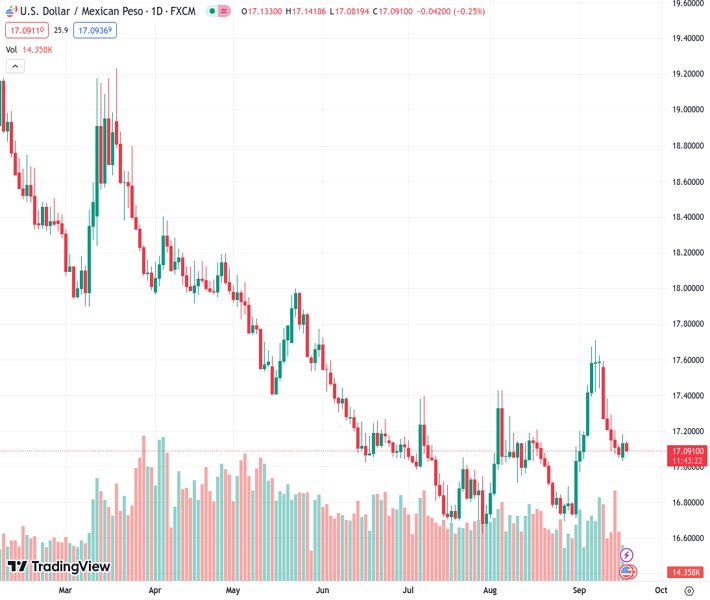
The US dollar to Mexican peso exchange rate of 17.0910 experiences a decline, undoing the gains made on the previous day, as the Federal Reserve’s policy decision approaches.
…
This is a premium post.
[s2If !current_user_can(access_s2member_level4)]Please register for FREE REGISTER to read full post below containing analysis. In case of any error or you think you are not able to read the full post below, please email us at support#nehcap.com [lwa][/s2If] [s2If current_user_can(access_s2member_level1)]
- USD/MXN reverses the previous day’s gains ahead of the Fed policy decision.
The pair currently trades last at 17.0910.
The previous day high was 17.1825 while the previous day low was 17.0304. The daily 38.2% Fib levels comes at 17.1244, expected to provide resistance. Similarly, the daily 61.8% fib level is at 17.0885, expected to provide support.
USD/MXN retraces the previous day’s gains, trading lower around 17.1040 during the European session on Tuesday. Investors caution ahead of the US Federal Reserve’s (Fed) policy decision contributes the support for undermining the pair.
The immediate support for the USD/MXN pair appears around the weekly low at 17.0308, followed by the 17.0000 psychological level.
If bearish sentiment exerts pressure, the pair could potentially approach the next support level near the 16.9000 psychological level.
The USD/MXN pair could face a challenge around the seven-day Exponential Moving Average (EMA) at 17.1625, following the 23.6% Fibonacci retracement at 17.1904 level.
A firm break above the latter could open the doors for the pair to explore the region around the 17.2000 psychological level.
The Moving Average Convergence Divergence (MACD) line remains above the centerline, but it exhibits a pattern of divergence beneath the signal line. This pattern indicates that the recent uptrend in the USD/MXN pair is losing strength.
However, the 14-day Relative Strength Index (RSI) indicates bearish momentum in the short term as it lies below the 50 level.
Technical Levels: Supports and Resistances
USDMXN currently trading at 17.1044 at the time of writing. Pair opened at 17.1355 and is trading with a change of -0.18 % .
| Overview | Overview.1 | |
|---|---|---|
| 0 | Today last price | 17.1044 |
| 1 | Today Daily Change | -0.0311 |
| 2 | Today Daily Change % | -0.1800 |
| 3 | Today daily open | 17.1355 |
The pair is trading below its 20 Daily moving average @ 17.1046, above its 50 Daily moving average @ 17.0167 , below its 100 Daily moving average @ 17.2252 and below its 200 Daily moving average @ 17.9425
| Trends | Trends.1 | |
|---|---|---|
| 0 | Daily SMA20 | 17.1046 |
| 1 | Daily SMA50 | 17.0167 |
| 2 | Daily SMA100 | 17.2252 |
| 3 | Daily SMA200 | 17.9425 |
The previous day high was 17.1825 while the previous day low was 17.0304. The daily 38.2% Fib levels comes at 17.1244, expected to provide resistance. Similarly, the daily 61.8% fib level is at 17.0885, expected to provide support.
Note the levels of interest below:
- Pivot support is noted at 17.0497, 16.964, 16.8976
- Pivot resistance is noted at 17.2019, 17.2683, 17.354
| Levels | Levels.1 |
|---|---|
| Previous Daily High | 17.1825 |
| Previous Daily Low | 17.0304 |
| Previous Weekly High | 17.5959 |
| Previous Weekly Low | 17.0504 |
| Previous Monthly High | 17.4274 |
| Previous Monthly Low | 16.6945 |
| Daily Fibonacci 38.2% | 17.1244 |
| Daily Fibonacci 61.8% | 17.0885 |
| Daily Pivot Point S1 | 17.0497 |
| Daily Pivot Point S2 | 16.9640 |
| Daily Pivot Point S3 | 16.8976 |
| Daily Pivot Point R1 | 17.2019 |
| Daily Pivot Point R2 | 17.2683 |
| Daily Pivot Point R3 | 17.3540 |
[/s2If]
Download Nehcap EAWe have two EAs that are operational on our LIVE accounts.
- EA-FIX: Check out the details here. Download EA-FIX . EA-FIX is a non-grid HFT scalper.
- EA-GROWTH: High quality low dd EA using trend grids. Download EA_GROWTHJoin Our Telegram Group
")


