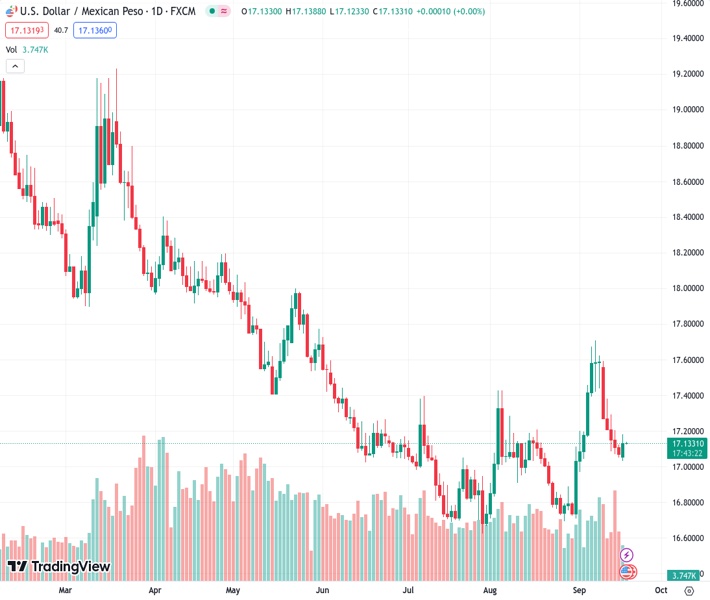
The US dollar to Mexican peso exchange rate is moving horizontally at 17.1325, with investors becoming wary in anticipation of the Federal Reserve’s upcoming decision.
…
This is a premium post.
[s2If !current_user_can(access_s2member_level4)]Please register for FREE REGISTER to read full post below containing analysis. In case of any error or you think you are not able to read the full post below, please email us at support#nehcap.com [lwa][/s2If] [s2If current_user_can(access_s2member_level1)]
- USD/MXN trades sideways as the investors turn cautious ahead of the Fed decision.
The pair currently trades last at 17.1325.
The previous day high was 17.1825 while the previous day low was 17.0304. The daily 38.2% Fib levels comes at 17.1244, expected to provide support. Similarly, the daily 61.8% fib level is at 17.0885, expected to provide support.
USD/MXN moves sideways around 17.1350 during the Asian session on Tuesday, as it attempts to continue the downward trend from the previous day’s gains. However, investors caution ahead of the US Federal Reserve’s (Fed) policy decision to put pressure on the Mexican Peso (MXN).
US Dollar (USD) is under pressure as the Fed is expected to keep its current interest rates in the upcoming meeting scheduled for Wednesday. However, investors are cautious due to the possibility of a 25 basis points interest rate hike by the end of 2023, which is supported by resilient economic data from the United States (US).
Traders are also factoring in the possibility that the Fed may keep interest rates elevated for an extended period, which could provide support for the Greenback. They will closely monitor the central bank’s statements for any indications or information regarding the potential future trajectory of interest rates.
US Dollar Index (DXY) is making an effort to break its two-day losing streak, trading higher around 105.10. However, US Treasury yields are struggling to recover from the losses observed on Monday, with the yield on the US 10-year bond at 4.30% at the time of writing. The lower yields are putting downward pressure on the strength of the Greenback.
On the other side, the Mexican currency has been affected by increased risk aversion, partly due to the recovery in oil prices. This has raised concerns that central banks may keep their restrictive monetary policies in place for a longer period or even consider tightening them further.
Furthermore, macro data released on Monday showed that Mexico’s Private Spending (YoY) grew by 4.3% in Q2, below the previous reading of 4.8%. While quarter-over-quarter results showed growth of 1.0%, lower than the previous rate of 2.2%.
The focus will be on Thursday’s release of Retail Sales for July and Friday’s release of inflation data for the first half of September, as it could provide new clues about the future direction of the Bank of Mexico’s interest rates.
Technical Levels: Supports and Resistances
USDMXN currently trading at 17.1336 at the time of writing. Pair opened at 17.1355 and is trading with a change of -0.01 % .
| Overview | Overview.1 | |
|---|---|---|
| 0 | Today last price | 17.1336 |
| 1 | Today Daily Change | -0.0019 |
| 2 | Today Daily Change % | -0.0100 |
| 3 | Today daily open | 17.1355 |
The pair is trading above its 20 Daily moving average @ 17.1046, above its 50 Daily moving average @ 17.0167 , below its 100 Daily moving average @ 17.2252 and below its 200 Daily moving average @ 17.9425
| Trends | Trends.1 | |
|---|---|---|
| 0 | Daily SMA20 | 17.1046 |
| 1 | Daily SMA50 | 17.0167 |
| 2 | Daily SMA100 | 17.2252 |
| 3 | Daily SMA200 | 17.9425 |
The previous day high was 17.1825 while the previous day low was 17.0304. The daily 38.2% Fib levels comes at 17.1244, expected to provide support. Similarly, the daily 61.8% fib level is at 17.0885, expected to provide support.
Note the levels of interest below:
- Pivot support is noted at 17.0497, 16.964, 16.8976
- Pivot resistance is noted at 17.2019, 17.2683, 17.354
| Levels | Levels.1 |
|---|---|
| Previous Daily High | 17.1825 |
| Previous Daily Low | 17.0304 |
| Previous Weekly High | 17.5959 |
| Previous Weekly Low | 17.0504 |
| Previous Monthly High | 17.4274 |
| Previous Monthly Low | 16.6945 |
| Daily Fibonacci 38.2% | 17.1244 |
| Daily Fibonacci 61.8% | 17.0885 |
| Daily Pivot Point S1 | 17.0497 |
| Daily Pivot Point S2 | 16.9640 |
| Daily Pivot Point S3 | 16.8976 |
| Daily Pivot Point R1 | 17.2019 |
| Daily Pivot Point R2 | 17.2683 |
| Daily Pivot Point R3 | 17.3540 |
[/s2If]
Download Nehcap EAWe have two EAs that are operational on our LIVE accounts.
- EA-FIX: Check out the details here. Download EA-FIX . EA-FIX is a non-grid HFT scalper.
- EA-GROWTH: High quality low dd EA using trend grids. Download EA_GROWTHJoin Our Telegram Group
")


