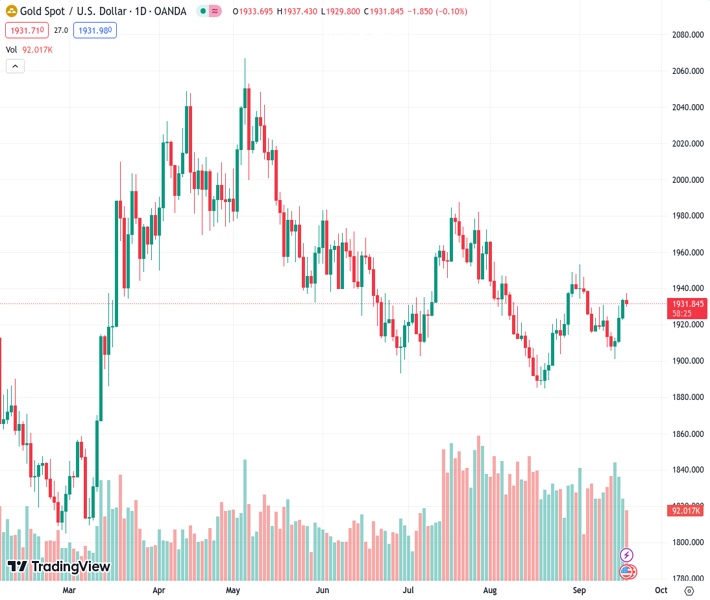
The price of gold, represented by XAUUSD, reached its highest point in two weeks at $1937.35 before dropping slightly to $1931.77, a decrease of 0.06%.
…
This is a premium post.
[s2If !current_user_can(access_s2member_level4)]Please register for FREE REGISTER to read full post below containing analysis. In case of any error or you think you are not able to read the full post below, please email us at support#nehcap.com [lwa][/s2If] [s2If current_user_can(access_s2member_level1)]
- Gold price hit a two-week high at $1937.35 before retreating to $1931.77, down 0.06%.
The pair currently trades last at 1931.91.
The previous day high was 1934.32 while the previous day low was 1922.62. The daily 38.2% Fib levels comes at 1929.85, expected to provide support. Similarly, the daily 61.8% fib level is at 1927.09, expected to provide support.
Gold price retreats after hitting a two-week high at $1937.35 as investors remain on the sidelines ahead of the US Federal Reserve monetary policy decision. US Treasury bond yields are climbing ahead of the Fed’s decision, a headwind for the yellow metal, which was shy of clashing with the 100-DMA. At the time of writing, the XAU/USD is trading at $1931.77, down 0.06%.
Wall Street continues to print losses, while the US 10-year Treasury bond yield touches a 16-year high at 4.367%. Tomorrow, Fed Chair Jerome Powell and his colleagues are expected to keep rates at the current 5.25%-5.50% range and to keep them higher for longer, at least until July 2024, as drawn by the Fed money market futures.
Even though the latest round of data showed that inflation has registered back-to-back upticks, the US central bank is set to skip a rate hike in September. According to the CME FedWatch Tool, odds for the November and December meeting had been lowered, suggesting that traders are not expecting additional rate hikes toward the end of 2023.
Although the Fed’s decision is important, market participants would be focused on the ‘dot plots’ to review the US central bank interest rate path. According to the latest Summary of Economic Projections (SEP), the Fed’s median estimates rates to peak at 5.6%. A confirmation could catch off guard interest rate traders, which expect rates to be capped at 5.50%.
In the meantime, the US Dollar Index (DXY) remains firm at around 105.14, gains 0.06%, underpinned by high US Treasury bond yields. The US 10-year Treasury note yields 4.367%, its highest level in 16 years, a headwind for Gold prices.
Meanwhile, Gold traders must also be aware of US Real yields, which could be followed using TIPS (Treasury Inflation Protected Securities) as a proxy. When the US 10-year TIPS coupon rises, XAU/USD’s price falls, as shown by the following chart, depicting the inverse correlation between the assets.
Source: Refinitiv
The US economic docket would feature the Fed’s decision on Wednesday, followed by US housing data, unemployment claims, and S&P Global PMIs.
Gold trades sideways inside a descending triangle, cushioned on the downside by a confluence of daily moving averages (DMAs), and the 100-DMA acts as resistance at $1945.20. Although it recorded a higher low on September 14 at $1901.11, it has failed to print a higher peak above the July 20 swing high at $1987.42. If buyers want to shift the bias to neutral, they must reclaim the latter. Otherwise, a break below the confluence of the 20 and 200-DMA around $1924.00 could pave the way to challenge $1900, followed by the August 21 daily low of $1884.89
Technical Levels: Supports and Resistances
XAUUSD currently trading at 1931.99 at the time of writing. Pair opened at 1933.82 and is trading with a change of -0.09 % .
| Overview | Overview.1 | |
|---|---|---|
| 0 | Today last price | 1931.99 |
| 1 | Today Daily Change | -1.83 |
| 2 | Today Daily Change % | -0.09 |
| 3 | Today daily open | 1933.82 |
The pair is trading above its 20 Daily moving average @ 1922.88, below its 50 Daily moving average @ 1932.0 , below its 100 Daily moving average @ 1946.42 and above its 200 Daily moving average @ 1922.91
| Trends | Trends.1 | |
|---|---|---|
| 0 | Daily SMA20 | 1922.88 |
| 1 | Daily SMA50 | 1932.00 |
| 2 | Daily SMA100 | 1946.42 |
| 3 | Daily SMA200 | 1922.91 |
The previous day high was 1934.32 while the previous day low was 1922.62. The daily 38.2% Fib levels comes at 1929.85, expected to provide support. Similarly, the daily 61.8% fib level is at 1927.09, expected to provide support.
Note the levels of interest below:
- Pivot support is noted at 1926.19, 1918.55, 1914.49
- Pivot resistance is noted at 1937.89, 1941.95, 1949.59
| Levels | Levels.1 |
|---|---|
| Previous Daily High | 1934.32 |
| Previous Daily Low | 1922.62 |
| Previous Weekly High | 1930.77 |
| Previous Weekly Low | 1901.07 |
| Previous Monthly High | 1966.08 |
| Previous Monthly Low | 1884.85 |
| Daily Fibonacci 38.2% | 1929.85 |
| Daily Fibonacci 61.8% | 1927.09 |
| Daily Pivot Point S1 | 1926.19 |
| Daily Pivot Point S2 | 1918.55 |
| Daily Pivot Point S3 | 1914.49 |
| Daily Pivot Point R1 | 1937.89 |
| Daily Pivot Point R2 | 1941.95 |
| Daily Pivot Point R3 | 1949.59 |
[/s2If]
Download Nehcap EAWe have two EAs that are operational on our LIVE accounts.
- EA-FIX: Check out the details here. Download EA-FIX . EA-FIX is a non-grid HFT scalper.
- EA-GROWTH: High quality low dd EA using trend grids. Download EA_GROWTHJoin Our Telegram Group
")


