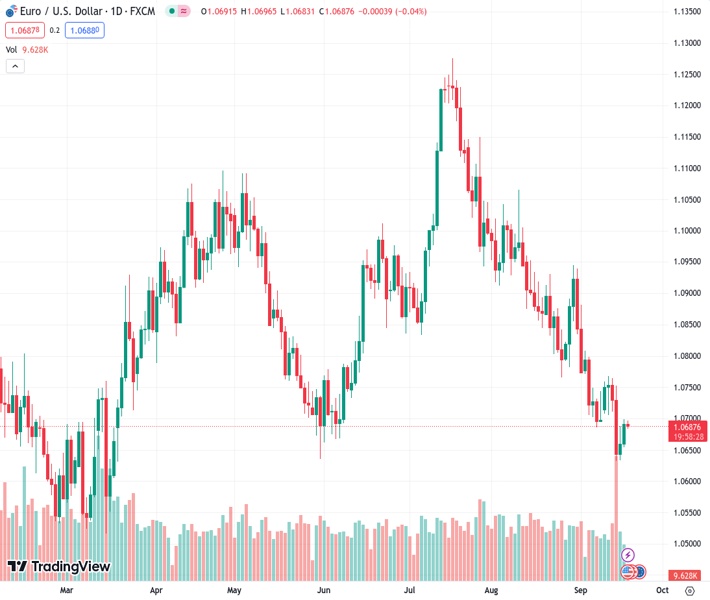
The EURUSD pair, trading at 1.06892, is experiencing indecisiveness and fluctuating within a certain range during the day.
…
This is a premium post.
[s2If !current_user_can(access_s2member_level4)]Please register for FREE REGISTER to read full post below containing analysis. In case of any error or you think you are not able to read the full post below, please email us at support#nehcap.com [lwa][/s2If] [s2If current_user_can(access_s2member_level1)]
- EUR/USD lacks any firm intraday direction and oscillates in a range on Tuesday.
The pair currently trades last at 1.06892.
The previous day high was 1.0699 while the previous day low was 1.0655. The daily 38.2% Fib levels comes at 1.0682, expected to provide support. Similarly, the daily 61.8% fib level is at 1.0672, expected to provide support.
The EUR/USD pair struggles to capitalize on its recent recovery gains registered over the past two days and oscillates in a narrow band during the Asian session on Tuesday. Spot prices currently trade just below the 1.0700 round-figure mark and remain well within the striking distance of a six-month low touched in the aftermath of the dovish European Central Bank (ECB) rate decision last Thursday.
The ECB opted to hike rates for the 10th straight time, by 25 bps, taking its main rate to an all-time high level of 4% to counter stubbornly high inflation. In the accompanying monetary policy statement, the central bank, however, sent a clear message that the 14-month-long policy tightening cycle could have reached its peak already. Furthermore, the downgrading of CPI and GDP growth forecasts for the coming years – 2024 and 2025 – reaffirmed expectations that further hikes may be off the table for now. This, in turn, is seen acting as a headwind for the shared currency, though a softer tone surrounding the US Dollar (USD) continues to lend some support to the EUR/USD pair.
The USD Index (DXY), which tracks the Greenback against a basket of currencies, remains depressed below its highest level since March set last week as traders seem reluctant to place fresh bullish bets ahead of the key central bank event risk. The Federal Reserve (Fed) is scheduled to announce the outcome of the highly-anticipated two-day monetary policy meeting on Wednesday and is widely expected to stand path. That said, the markets are still pricing in the possibility of one more 25 bps lift-off by the end of this year. The bets were lifted by resilient US macro data released recently and still-sticky inflation, which should allow the Fed to keep interest rates higher for longer.
Hence, investors will keep a close eye on the so-called ‘dot plot’ and inflation expectations. Apart from this, Fed Chair Jerome Powell’s remarks at the post-meeting press conference will be scrutinized closely for fresh cues about the future rate-hike path. This, in turn, will play a key role in influencing the near-term USD price dynamics and help determine the next leg of a directional move for the EUR/USD pair. Heading into the key central bank event risk, the final Euro Zone CPI print might provide some impetus ahead of the US housing market data – Building Permits and Housing Starts. The aforementioned fundamental backdrop, meanwhile, seems tilted in favour of bullish traders.
Hence, any subsequent move up might still be seen as a selling opportunity and runs the risk of fizzling out rather quickly. Bearish traders, however, might wait for weakness below the 1.0635-1.0630 region before positioning for an extension of a two-month-old downtrend from the 1.1275 zone, or a 17-month top touched in July. The EUR/USD pair might then turn vulnerable to accelerate the fall towards challenging the YTD low, around the 1.0480 area set in January.
Technical Levels: Supports and Resistances
EURUSD currently trading at 1.0693 at the time of writing. Pair opened at 1.0692 and is trading with a change of 0.01 % .
| Overview | Overview.1 | |
|---|---|---|
| 0 | Today last price | 1.0693 |
| 1 | Today Daily Change | 0.0001 |
| 2 | Today Daily Change % | 0.0100 |
| 3 | Today daily open | 1.0692 |
The pair remains strongly bearish on the daily time frame. It trades below the 20 SMA @ 1.0771, 50 SMA 1.0924, 100 SMA @ 1.0892 and 200 SMA @ 1.0829.
| Trends | Trends.1 | |
|---|---|---|
| 0 | Daily SMA20 | 1.0771 |
| 1 | Daily SMA50 | 1.0924 |
| 2 | Daily SMA100 | 1.0892 |
| 3 | Daily SMA200 | 1.0829 |
The previous day high was 1.0699 while the previous day low was 1.0655. The daily 38.2% Fib levels comes at 1.0682, expected to provide support. Similarly, the daily 61.8% fib level is at 1.0672, expected to provide support.
Note the levels of interest below:
- Pivot support is noted at 1.0665, 1.0638, 1.0621
- Pivot resistance is noted at 1.0709, 1.0726, 1.0753
| Levels | Levels.1 |
|---|---|
| Previous Daily High | 1.0699 |
| Previous Daily Low | 1.0655 |
| Previous Weekly High | 1.0769 |
| Previous Weekly Low | 1.0632 |
| Previous Monthly High | 1.1065 |
| Previous Monthly Low | 1.0766 |
| Daily Fibonacci 38.2% | 1.0682 |
| Daily Fibonacci 61.8% | 1.0672 |
| Daily Pivot Point S1 | 1.0665 |
| Daily Pivot Point S2 | 1.0638 |
| Daily Pivot Point S3 | 1.0621 |
| Daily Pivot Point R1 | 1.0709 |
| Daily Pivot Point R2 | 1.0726 |
| Daily Pivot Point R3 | 1.0753 |
[/s2If]
Download Nehcap EAWe have two EAs that are operational on our LIVE accounts.
- EA-FIX: Check out the details here. Download EA-FIX . EA-FIX is a non-grid HFT scalper.
- EA-GROWTH: High quality low dd EA using trend grids. Download EA_GROWTHJoin Our Telegram Group
")


