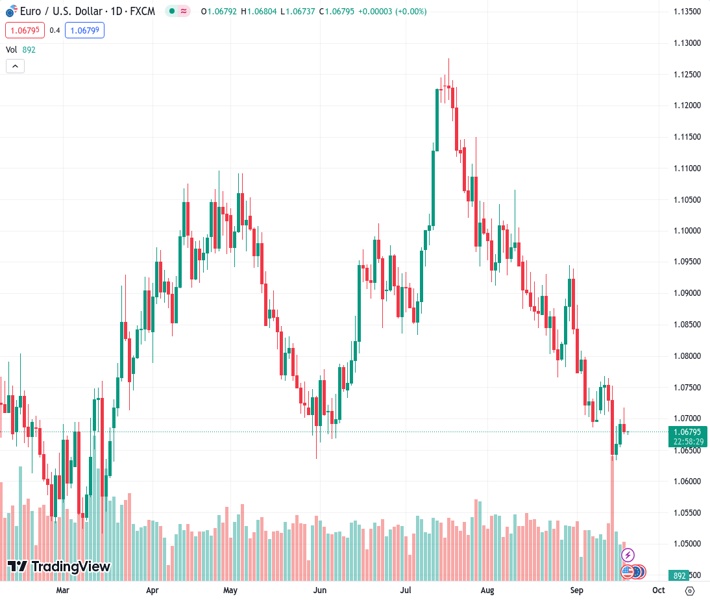
The EURUSD currency pair is currently trading at 1.0677, slightly decreasing its value by 0.01%. This decline is attributed to the US 10-year Treasury yields, which have reached the highest level in 16 years.
…
This is a premium post.
[s2If !current_user_can(access_s2member_level4)]Please register for FREE REGISTER to read full post below containing analysis. In case of any error or you think you are not able to read the full post below, please email us at support#nehcap.com [lwa][/s2If] [s2If current_user_can(access_s2member_level1)]
- EUR/USD trades at 1.0677, extending its losses by 0.01% as US 10-year Treasury yields hit a 16-year high.
The pair currently trades last at 1.06796.
The previous day high was 1.0699 while the previous day low was 1.0655. The daily 38.2% Fib levels comes at 1.0682, expected to provide resistance. Similarly, the daily 61.8% fib level is at 1.0672, expected to provide support.
As the Asian session begins, the Euro (EUR) extends its losses by a minuscule 0.01% against the US Dollar (USD) as market participants prepare for the US Federal Reserve’s decision. The Greenback stages a comeback propelled by a jump in US Treasury bond yields. The EUR/USD is trading at 1.0677, following Tuesday’s losses of 0.12%.
US equities ended the day with losses. The US 10-year Treasury bond yield skyrocketed to a 16-year high at 4.367%, a headwind for the EUR/USD, which remains close to the 1.0700 figure, but it’s set to continue to print losses amidst speculations the Fed would deliver a hawkish hold.
Given that recent data in the United States (US) showed the robustness of the economy, with a hot jobs market, improvement in business activity, and consumer spending expanding – though at a lower rhythm – are reasons for the Fed Chair Powell and Co to keep “at it,” and hold rates higher for longer. Furthermore, last week’s Consumer and Producer Price Index (CPI and PPI) printed higher readings, justifying the need for higher rates.
Besides delivering its monetary policy decision, policymakers would update their economic projections regarding growth, unemployment rate, inflation, and the Federal Funds Rates (FFR). In June, Fed officials expected the FFR to peak at around 5.60%. Despite that, money market futures are pricing the FFR to peak at around 5.46%.
Data-wise, a scarce US economic docket revealed housing data, which came mixed. US Building Permits improved compared to July’s 0.1% expansion grew by 6.9%, while Housing Starts plunged -11.3%, beneath the -2.5% contraction estimated.
Across the pond, the Eurozone (EU) economic docket revealed inflation data. The Harmonised Index of Consumer Prices (HICP) for August came at 5.2% YoY, below 5.3% estimates, while core HICP stood at 5.3% unchanged, aligned with estimates.
Recently, some European Central Bank (ECB) officials signaled the ECB would not continue to tighten monetary conditions. Nevertheless, an ongoing economic deceleration in the bloc and a deposit rate at its highest level since the Euro’s inception at 4.00% could bring inflation towards its target.
A poll by Reuters showed that 70 economists commented the ECB is done hiking rates and that the deposit rate would end the year at its current 4.00% level. Although the ECB’s President Christine Lagarde refrained from saying that rates have peaked, money market futures see a 25% chance for additional hiking towards the end of the year.
Given the backdrop, if the Fed delivers a hawkish hold, expect further EUR/USD’s downside; otherwise, the single currency could rally and reclaim the 1.0700 level, with buyers eyeing 1.0800.
The daily chart portrays an ‘evening star’ in the making, as Tuesday’s candle was an ‘inverted hammer’, which could pave the way for further downside. Yet, upside risks remain, with the EUR/USD close to the 1.0700 figure. A hawkish hold by the Fed could open the door to test the September 14 swing low of 1.0632, followed by the 1.0600 figure ahead of plunging toward Mach’s low of 1.0516. Conversely, a dovish surprise and the EUR/USD could rally past the September 19 high at 1.0718 and target the 200-day Moving Average (DMA) at 1.0828.
Technical Levels: Supports and Resistances
EURUSD currently trading at 1.0679 at the time of writing. Pair opened at 1.0692 and is trading with a change of -0.12 % .
| Overview | Overview.1 | |
|---|---|---|
| 0 | Today last price | 1.0679 |
| 1 | Today Daily Change | -0.0013 |
| 2 | Today Daily Change % | -0.1200 |
| 3 | Today daily open | 1.0692 |
The pair remains strongly bearish on the daily time frame. It trades below the 20 SMA @ 1.0771, 50 SMA 1.0924, 100 SMA @ 1.0892 and 200 SMA @ 1.0829.
| Trends | Trends.1 | |
|---|---|---|
| 0 | Daily SMA20 | 1.0771 |
| 1 | Daily SMA50 | 1.0924 |
| 2 | Daily SMA100 | 1.0892 |
| 3 | Daily SMA200 | 1.0829 |
The previous day high was 1.0699 while the previous day low was 1.0655. The daily 38.2% Fib levels comes at 1.0682, expected to provide resistance. Similarly, the daily 61.8% fib level is at 1.0672, expected to provide support.
Note the levels of interest below:
- Pivot support is noted at 1.0665, 1.0638, 1.0621
- Pivot resistance is noted at 1.0709, 1.0726, 1.0753
| Levels | Levels.1 |
|---|---|
| Previous Daily High | 1.0699 |
| Previous Daily Low | 1.0655 |
| Previous Weekly High | 1.0769 |
| Previous Weekly Low | 1.0632 |
| Previous Monthly High | 1.1065 |
| Previous Monthly Low | 1.0766 |
| Daily Fibonacci 38.2% | 1.0682 |
| Daily Fibonacci 61.8% | 1.0672 |
| Daily Pivot Point S1 | 1.0665 |
| Daily Pivot Point S2 | 1.0638 |
| Daily Pivot Point S3 | 1.0621 |
| Daily Pivot Point R1 | 1.0709 |
| Daily Pivot Point R2 | 1.0726 |
| Daily Pivot Point R3 | 1.0753 |
[/s2If]
Download Nehcap EAWe have two EAs that are operational on our LIVE accounts.
- EA-FIX: Check out the details here. Download EA-FIX . EA-FIX is a non-grid HFT scalper.
- EA-GROWTH: High quality low dd EA using trend grids. Download EA_GROWTHJoin Our Telegram Group
")


