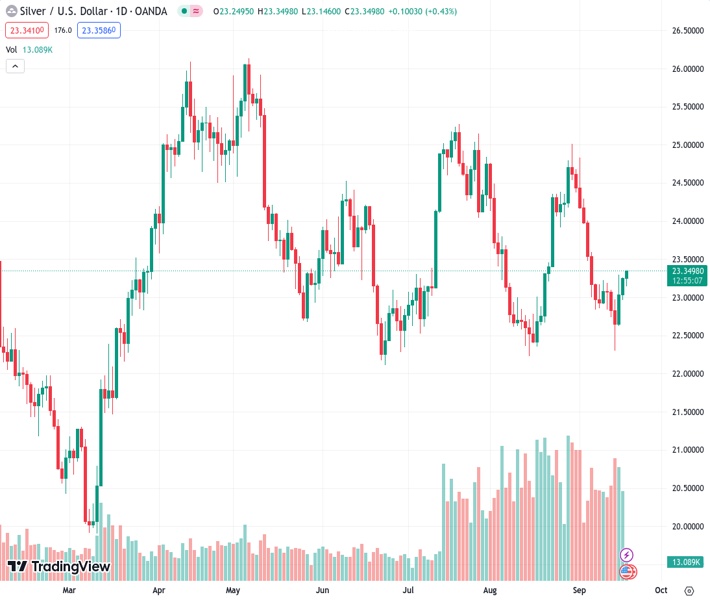
Silver was able to recover on Tuesday and reach its highest point in almost two weeks due to some people buying during a temporary decrease in its price.
…
This is a premium post.
[s2If !current_user_can(access_s2member_level4)]Please register for FREE REGISTER to read full post below containing analysis. In case of any error or you think you are not able to read the full post below, please email us at support#nehcap.com [lwa][/s2If] [s2If current_user_can(access_s2member_level1)]
- Silver attracts some dip-buying on Tuesday and climbs back to a nearly two-week top.
The pair currently trades last at 23.334.
The previous day high was 23.26 while the previous day low was 22.96. The daily 38.2% Fib levels comes at 23.15, expected to provide support. Similarly, the daily 61.8% fib level is at 23.08, expected to provide support.
Silver reverses modest intraday losses to the $23.15 area and climbs back closer to a nearly two-week high touched this Tuesday. The white metal now trades around the $23.25 region during the early European session, nearly unchanged for the day.
From a technical perspective, oscillators on the daily chart – though have been recovering from lower levels – are still holding in the negative territory and favour bearish traders. That said, last week’s solid bounce from the $22.30 support area – representing an ascending trend line extending from the June monthly low – and the subsequent strength warrants caution before positioning for deeper losses ahead of the pivotal FOMC monetary policy decision on Wednesday.
In the meantime, any meaningful decline is likely to find some support near the $23.00 round figure ahead of the $22.80 area and the $23.30 region or a nearly one-month low touched last Thursday. A convincing break below the latter will be seen as a fresh trigger for bearish traders and make the XAG/USD vulnerable to accelerate the fall towards the next relevant support near the $21.25 zone. The downward trajectory could get extended further towards the $21.00 mark.
On the flip side, momentum beyond the $23.30 area, or the daily peak, could face stiff resistance and remain capped near a technically significant 200-day Simple Moving Average (SMA), currently pegged around the $23.45 region. A sustained breakout, however, could shift the bias in favour of bullish traders. This, in turn, should allow the XAG/USD to climb further beyond the 100-day SMA barrier near the $23.80 region and aim to reclaim the $24.00 round-figure mark.
The next relevant hurdle is pegged near the $24.30-$24.35 region, above which the XAG/USD is likely to conquer the $25.00 psychological mark. The latter coincides with the August monthly swing high and is closely followed by the July peak, around the $25.25 region.
Technical Levels: Supports and Resistances
XAGUSD currently trading at 23.21 at the time of writing. Pair opened at 23.26 and is trading with a change of -0.21 % .
| Overview | Overview.1 | |
|---|---|---|
| 0 | Today last price | 23.21 |
| 1 | Today Daily Change | -0.05 |
| 2 | Today Daily Change % | -0.21 |
| 3 | Today daily open | 23.26 |
The pair remains strongly bearish on the daily time frame. It trades below the 20 SMA @ 23.64, 50 SMA 23.74, 100 SMA @ 23.72 and 200 SMA @ 23.48.
| Trends | Trends.1 | |
|---|---|---|
| 0 | Daily SMA20 | 23.64 |
| 1 | Daily SMA50 | 23.74 |
| 2 | Daily SMA100 | 23.72 |
| 3 | Daily SMA200 | 23.48 |
The previous day high was 23.26 while the previous day low was 22.96. The daily 38.2% Fib levels comes at 23.15, expected to provide support. Similarly, the daily 61.8% fib level is at 23.08, expected to provide support.
Note the levels of interest below:
- Pivot support is noted at 23.06, 22.86, 22.76
- Pivot resistance is noted at 23.36, 23.46, 23.65
| Levels | Levels.1 |
|---|---|
| Previous Daily High | 23.26 |
| Previous Daily Low | 22.96 |
| Previous Weekly High | 23.29 |
| Previous Weekly Low | 22.30 |
| Previous Monthly High | 25.02 |
| Previous Monthly Low | 22.23 |
| Daily Fibonacci 38.2% | 23.15 |
| Daily Fibonacci 61.8% | 23.08 |
| Daily Pivot Point S1 | 23.06 |
| Daily Pivot Point S2 | 22.86 |
| Daily Pivot Point S3 | 22.76 |
| Daily Pivot Point R1 | 23.36 |
| Daily Pivot Point R2 | 23.46 |
| Daily Pivot Point R3 | 23.65 |
[/s2If]
Download Nehcap EAWe have two EAs that are operational on our LIVE accounts.
- EA-FIX: Check out the details here. Download EA-FIX . EA-FIX is a non-grid HFT scalper.
- EA-GROWTH: High quality low dd EA using trend grids. Download EA_GROWTHJoin Our Telegram Group
")


