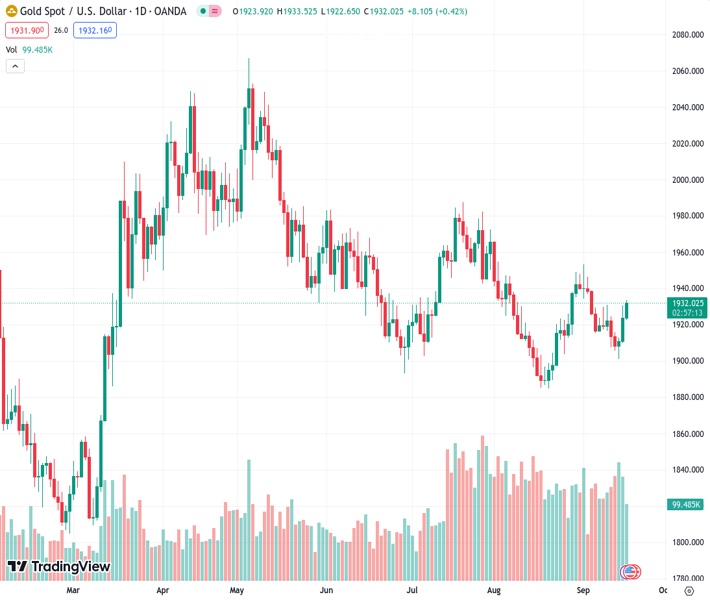
The XAUUSD increased by 0.40% and reached the $1,930 range, starting from a value of 1,932.01.
…
This is a premium post.
[s2If !current_user_can(access_s2member_level4)]Please register for FREE REGISTER to read full post below containing analysis. In case of any error or you think you are not able to read the full post below, please email us at support#nehcap.com [lwa][/s2If] [s2If current_user_can(access_s2member_level1)]
- XAU/USD rose to the $1,930 area, up by 0.40%.
The pair currently trades last at 1932.01.
The previous day high was 1930.47 while the previous day low was 1909.83. The daily 38.2% Fib levels comes at 1922.59, expected to provide support. Similarly, the daily 61.8% fib level is at 1917.71, expected to provide support.
On Monday, the Gold spot price XAU/USD is holding above the 20 and 200-day Simple Moving Average (SMA) convergence at $1,922-1,923, rising to $1,930. Markets remain cautious ahead of the Federal Reserve (Fed), Bank of England (BoE) and Bank of Japan (BoJ), where the British bank is the only one expected to hike rates.
In line with that, similar to the European Central Bank (ECB) last week, the (BoE) is expected to deliver a dovish 25 basis point hike, highlighting stagflation risks. Likewise, investors are discounting that the BoJ will maintain its ultra-dovish stance.
On the Fed’s side, it is widely expected to deliver a hawkish pause and try to convince markets that it isn’t the end of the tightening cycle. For the November and December meetings, investors are placing some bets for one last hike as economic activity remains strong while the labour market sees a mixed outlook. In addition, the Fed will release updated dot plots and fresh macro forecasts.
In the meantime, US Yields, often seen as the opportunity cost of holding Gold, are trading mixed but remain high, limiting the XAU/USD upside. The 10-year bond yield is 4.33%, with mild losses on the day. The 2-year yield stands at 5.06%, up by 0.50%, and the 5-year yield is at 4.45%, down by 0.30%.
Considering the daily chart, XAU/USD presents a neutral to bullish outlook, with the bulls showing resilience and gaining momentum. The Relative Strength Index (RSI) exhibits a bullish inclination with a positive slope above the 50 threshold, while the Moving Average Convergence (MACD) histogram presents rising green bars. Additionally, the pair is above the 20 and 200-day Simple Moving Average (SMAs), implying that the bulls retain control on a broader scale. Still, the buyers should target the 100-day SMA at $1,946 to confirm the recovery.
Support levels: $1,923 – $1,920 (200 and 20-day SMA), $1,910, $1,900.
Resistance levels: $1,946 (100-day SMA), $1,970, $2,000.
Technical Levels: Supports and Resistances
XAUUSD currently trading at 1931.95 at the time of writing. Pair opened at 1924.0 and is trading with a change of 0.41 % .
| Overview | Overview.1 | |
|---|---|---|
| 0 | Today last price | 1931.95 |
| 1 | Today Daily Change | 7.95 |
| 2 | Today Daily Change % | 0.41 |
| 3 | Today daily open | 1924.00 |
The pair is trading above its 20 Daily moving average @ 1920.94, above its 50 Daily moving average @ 1931.83 , below its 100 Daily moving average @ 1946.91 and above its 200 Daily moving average @ 1922.21
| Trends | Trends.1 | |
|---|---|---|
| 0 | Daily SMA20 | 1920.94 |
| 1 | Daily SMA50 | 1931.83 |
| 2 | Daily SMA100 | 1946.91 |
| 3 | Daily SMA200 | 1922.21 |
The previous day high was 1930.47 while the previous day low was 1909.83. The daily 38.2% Fib levels comes at 1922.59, expected to provide support. Similarly, the daily 61.8% fib level is at 1917.71, expected to provide support.
Note the levels of interest below:
- Pivot support is noted at 1912.4, 1900.79, 1891.76
- Pivot resistance is noted at 1933.04, 1942.07, 1953.68
| Levels | Levels.1 |
|---|---|
| Previous Daily High | 1930.47 |
| Previous Daily Low | 1909.83 |
| Previous Weekly High | 1930.77 |
| Previous Weekly Low | 1901.07 |
| Previous Monthly High | 1966.08 |
| Previous Monthly Low | 1884.85 |
| Daily Fibonacci 38.2% | 1922.59 |
| Daily Fibonacci 61.8% | 1917.71 |
| Daily Pivot Point S1 | 1912.40 |
| Daily Pivot Point S2 | 1900.79 |
| Daily Pivot Point S3 | 1891.76 |
| Daily Pivot Point R1 | 1933.04 |
| Daily Pivot Point R2 | 1942.07 |
| Daily Pivot Point R3 | 1953.68 |
[/s2If]
Download Nehcap EAWe have two EAs that are operational on our LIVE accounts.
- EA-FIX: Check out the details here. Download EA-FIX . EA-FIX is a non-grid HFT scalper.
- EA-GROWTH: High quality low dd EA using trend grids. Download EA_GROWTHJoin Our Telegram Group
")


