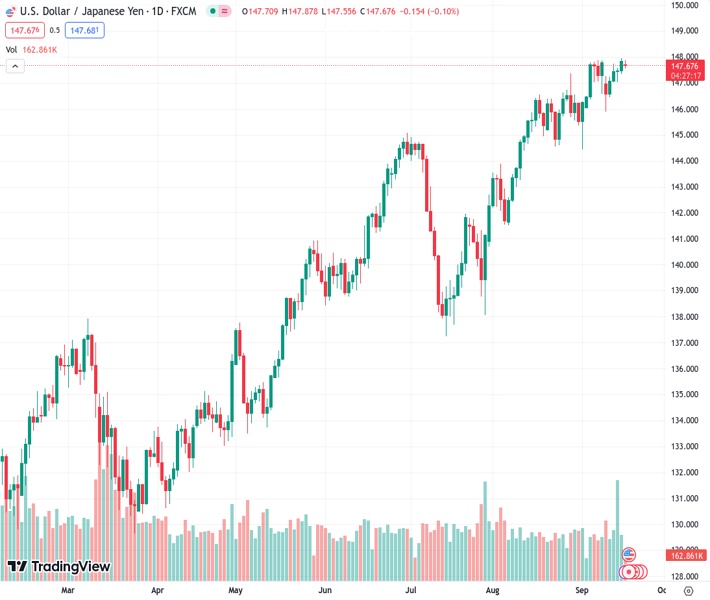
The USDJPY pair, trading at 147.692, experienced a slight drop close to 147.70. It appears that the buying sentiment is weakening.
…
This is a premium post.
[s2If !current_user_can(access_s2member_level4)]Please register for FREE REGISTER to read full post below containing analysis. In case of any error or you think you are not able to read the full post below, please email us at support#nehcap.com [lwa][/s2If] [s2If current_user_can(access_s2member_level1)]
- USD/JPY slightly declined towards 147.70, and bulls seem to be losing traction.
The pair currently trades last at 147.692.
The previous day high was 147.95 while the previous day low was 147.34. The daily 38.2% Fib levels comes at 147.72, expected to provide resistance. Similarly, the daily 61.8% fib level is at 147.57, expected to provide support.
At the start of the week, the USD/JPY saw some losses and declined to 147.70, mainly driven by the USD trading somewhat weak against its rivals. Both the Federal Reserve (Fed) and Bank of Japan (BoJ) will meet this week on Wednesday and Friday but no hikes are expected from either bank. Powell and Ueda’s stances will be closely watched. No relevant data will be released on Monday.
On the Fed’s side, markets anticipate that the bank will announce a hawkish, similar to the June meeting decision, in which the Fed decided to hold rates steady to asses the lags of monetary policy and their impact on the US economy. In that sense, the bank will try to convince the market that they will remain data-dependent but that the tightening cycle isn’t over.
In line with that, US Yields are seeing gains across the curve and remain high. The 10-year bond yield rose to 4.33% while the 2-year yield stands at 5.06%, up by 0.50%, and the 5-year yielding 4.46%.
On the other hand, the Bank of Japan (BoJ) has clarified that a monetary policy shift will only be considered once local wage and inflation metrics align with their anticipated outcomes. In addition, amid the local economy’s ongoing struggles and the added weight of Chinese economic troubles, the central bank remains hesitant to pivot its dovish stance. In that sense, the policy statement will be closely watched for clues on forward guidance.
The technical analysis of the daily chart suggests a shift towards a neutral to a bearish outlook for USD/JPY, with indications of bullish exhaustion. Having turned flat in positive territory, the Relative Strength Index (RSI) suggests a potential market equilibrium with balanced buying and selling pressure. The Moving Average Convergence (MACD), on the other hand, presents flat red bars. Furthermore, the pair is above the 20,100,200-day Simple Moving Average (SMAs), suggesting that the bulls are firmly in control of the bigger picture.
Support levels: 147.00, 146.60 (20-day SMA), 146.00.
Resistance levels: 148.00, 149.00, 150.00.
Technical Levels: Supports and Resistances
USDJPY currently trading at 147.63 at the time of writing. Pair opened at 147.85 and is trading with a change of -0.15 % .
| Overview | Overview.1 | |
|---|---|---|
| 0 | Today last price | 147.63 |
| 1 | Today Daily Change | -0.22 |
| 2 | Today Daily Change % | -0.15 |
| 3 | Today daily open | 147.85 |
The pair remains strongly bullish on the daily timeframe. It trades above its 20 SMA @ 146.66, 50 SMA 143.88, 100 SMA @ 141.82 and 200 SMA @ 137.35.
| Trends | Trends.1 | |
|---|---|---|
| 0 | Daily SMA20 | 146.66 |
| 1 | Daily SMA50 | 143.88 |
| 2 | Daily SMA100 | 141.82 |
| 3 | Daily SMA200 | 137.35 |
The previous day high was 147.95 while the previous day low was 147.34. The daily 38.2% Fib levels comes at 147.72, expected to provide resistance. Similarly, the daily 61.8% fib level is at 147.57, expected to provide support.
Note the levels of interest below:
- Pivot support is noted at 147.48, 147.1, 146.86
- Pivot resistance is noted at 148.09, 148.33, 148.7
| Levels | Levels.1 |
|---|---|
| Previous Daily High | 147.95 |
| Previous Daily Low | 147.34 |
| Previous Weekly High | 147.95 |
| Previous Weekly Low | 145.90 |
| Previous Monthly High | 147.38 |
| Previous Monthly Low | 141.51 |
| Daily Fibonacci 38.2% | 147.72 |
| Daily Fibonacci 61.8% | 147.57 |
| Daily Pivot Point S1 | 147.48 |
| Daily Pivot Point S2 | 147.10 |
| Daily Pivot Point S3 | 146.86 |
| Daily Pivot Point R1 | 148.09 |
| Daily Pivot Point R2 | 148.33 |
| Daily Pivot Point R3 | 148.70 |
[/s2If]
Download Nehcap EAWe have two EAs that are operational on our LIVE accounts.
- EA-FIX: Check out the details here. Download EA-FIX . EA-FIX is a non-grid HFT scalper.
- EA-GROWTH: High quality low dd EA using trend grids. Download EA_GROWTHJoin Our Telegram Group
")


