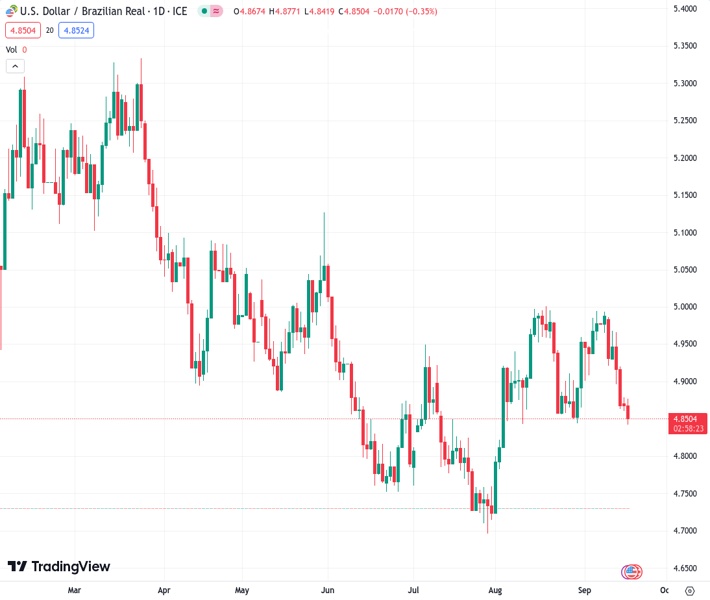
The US dollar to Brazilian real exchange rate, currently at 4.84990, decreased to around 4.8475, resulting in a loss of over 2% throughout September.
…
This is a premium post.
[s2If !current_user_can(access_s2member_level4)]Please register for FREE REGISTER to read full post below containing analysis. In case of any error or you think you are not able to read the full post below, please email us at support#nehcap.com [lwa][/s2If] [s2If current_user_can(access_s2member_level1)]
- USD/BRL declined towards 4.8475 and has already lost more than 2% in September.
The pair currently trades last at 4.84990.
The previous day high was 4.8782 while the previous day low was 4.8593. The daily 38.2% Fib levels comes at 4.8665, expected to provide resistance. Similarly, the daily 61.8% fib level is at 4.871, expected to provide resistance.
In Monday’s session, the USD/BRL continued to lose ground and has already tallied a 2.17% decline in September, falling to its lowest point since mid-August at 4.8475.
On the BRL’s side, it is gaining ground as the Brazilian government has taken up fiscal reforms, which are expected to positively impact the government’s account. On Tuesday, budget data will be reported, with the primary surplus expected to have doubled to BRL 16.8 billion in relation to March’s BRL 7.1 billion. In addition, the Real may also gather momentum on the outcome of Gross Domestic Product (GDP) and Trade data on Thursday.
On the USD side, it is trading soft against its rivals, with its DXY index consolidating. However, the US Treasury yields are still high, cushioning its losses. Regarding the Wednesday Federal Reserve (Fed) meeting, markets expect a hawkish pause, with the bank signalling that the tightening cycle isn’t done yet. Investors will also monitor fresh macro forecasts and revised dot plots to continue modelling their expectations towards the upcoming meetings. In that sense, the tone of the Fed will impact the price dynamics of the US Dollar and hence could limit the downside of the pair.
Technical indicators on the daily chart indicate that the USD/BRL sellers hold the upper hand. The downward slope of the Relative Strength Index (RSI) reinforces this negative sentiment, as does the MACD, which is displaying red bars, indicating a strengthening bearish momentum. Moreover, the pair is below the 20,100 and 200-day Simple Moving Averages (SMAs), suggesting that the bears are firmly in control of the bigger picture.
Support levels: 4.8427, 4.8115, 4.7880.
Resistance levels: 4.8902 (100-day SMA), 4.9143 (20-day SMA), 4.9450.
Technical Levels: Supports and Resistances
USDBRL currently trading at 4.8473 at the time of writing. Pair opened at 4.8665 and is trading with a change of -0.39 % .
| Overview | Overview.1 | |
|---|---|---|
| 0 | Today last price | 4.8473 |
| 1 | Today Daily Change | -0.0192 |
| 2 | Today Daily Change % | -0.3900 |
| 3 | Today daily open | 4.8665 |
The pair remains strongly bearish on the daily time frame. It trades below the 20 SMA @ 4.9217, 50 SMA 4.8758, 100 SMA @ 4.8929 and 200 SMA @ 5.0293.
| Trends | Trends.1 | |
|---|---|---|
| 0 | Daily SMA20 | 4.9217 |
| 1 | Daily SMA50 | 4.8758 |
| 2 | Daily SMA100 | 4.8929 |
| 3 | Daily SMA200 | 5.0293 |
The previous day high was 4.8782 while the previous day low was 4.8593. The daily 38.2% Fib levels comes at 4.8665, expected to provide resistance. Similarly, the daily 61.8% fib level is at 4.871, expected to provide resistance.
Note the levels of interest below:
- Pivot support is noted at 4.8578, 4.8491, 4.8389
- Pivot resistance is noted at 4.8767, 4.8869, 4.8956
| Levels | Levels.1 |
|---|---|
| Previous Daily High | 4.8782 |
| Previous Daily Low | 4.8593 |
| Previous Weekly High | 4.9871 |
| Previous Weekly Low | 4.8593 |
| Previous Monthly High | 4.9981 |
| Previous Monthly Low | 4.7239 |
| Daily Fibonacci 38.2% | 4.8665 |
| Daily Fibonacci 61.8% | 4.8710 |
| Daily Pivot Point S1 | 4.8578 |
| Daily Pivot Point S2 | 4.8491 |
| Daily Pivot Point S3 | 4.8389 |
| Daily Pivot Point R1 | 4.8767 |
| Daily Pivot Point R2 | 4.8869 |
| Daily Pivot Point R3 | 4.8956 |
[/s2If]
Download Nehcap EAWe have two EAs that are operational on our LIVE accounts.
- EA-FIX: Check out the details here. Download EA-FIX . EA-FIX is a non-grid HFT scalper.
- EA-GROWTH: High quality low dd EA using trend grids. Download EA_GROWTHJoin Our Telegram Group
")


