The exchange rate of AUDJPY at 95.0150 has not experienced significant changes and currently stands at 95.01. However, the recent movement in prices indicates the potential occurrence of a correction in the near future.
…
This is a premium post.
[s2If !current_user_can(access_s2member_level4)]Please register for FREE REGISTER to read full post below containing analysis. In case of any error or you think you are not able to read the full post below, please email us at support#nehcap.com [lwa][/s2If] [s2If current_user_can(access_s2member_level1)]
- AUD/JPY remains largely unchanged at 95.01, but recent price action suggests a possible correction could be on the horizon.
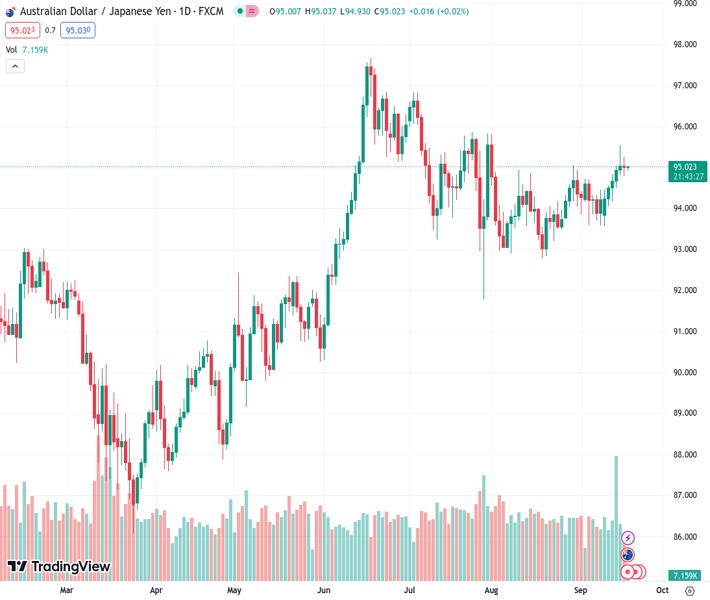
The pair currently trades last at 95.0150.
The previous day high was 95.55 while the previous day low was 94.81. The daily 38.2% Fib levels comes at 95.27, expected to provide resistance. Similarly, the daily 61.8% fib level is at 95.09, expected to provide resistance.
The Australian Dollar (AUD) trimmed some of its last week’s gains versus the Japanese Yen (JPY), which dropped 0.05% on Monday. However, as the Tuesday Asian session begins, the AUD/JPY hovers at around 95.01, unchanged.
From a daily chart perspective, the AUD/JPY is neutral to upward biased. Still, price action during the last couple of days suggests the cross-currency pair is headed for a correction, as it formed a ‘bearish-harami’ candlestick pattern formed by an inverted hammer and a doji. Hence, the cross-first support would be the 95.00 figure, followed by the top of the Ichimoku Cloud (Kumo) at 94.74, followed by the Tenkan-Sen line at 94.56, and followed by the Kijun-Sen at 94.17.
Short-term, the cross-currency pair has fallen below the Kumo, suggesting the pair turned bearish bias. To resume its downtrend, AUD/JPY sellers must drag prices below the September 18 swing low of 94.78. That would reaffirm the bearish bias and open the door to test the September 14 swing low of 94.50, followed by an upslope support trendline around 94.20/40. A decisive break and the 94.00 threshold would be next.
Technical Levels: Supports and Resistances
AUDJPY currently trading at 95.02 at the time of writing. Pair opened at 95.11 and is trading with a change of -0.09 % .
| Overview | Overview.1 | |
|---|---|---|
| 0 | Today last price | 95.02 |
| 1 | Today Daily Change | -0.09 |
| 2 | Today Daily Change % | -0.09 |
| 3 | Today daily open | 95.11 |
The pair remains strongly bullish on the daily timeframe. It trades above its 20 SMA @ 94.29, 50 SMA 94.29, 100 SMA @ 93.81 and 200 SMA @ 92.03.
| Trends | Trends.1 | |
|---|---|---|
| 0 | Daily SMA20 | 94.29 |
| 1 | Daily SMA50 | 94.29 |
| 2 | Daily SMA100 | 93.81 |
| 3 | Daily SMA200 | 92.03 |
The previous day high was 95.55 while the previous day low was 94.81. The daily 38.2% Fib levels comes at 95.27, expected to provide resistance. Similarly, the daily 61.8% fib level is at 95.09, expected to provide resistance.
Note the levels of interest below:
- Pivot support is noted at 94.76, 94.41, 94.02
- Pivot resistance is noted at 95.5, 95.9, 96.24
| Levels | Levels.1 |
|---|---|
| Previous Daily High | 95.55 |
| Previous Daily Low | 94.81 |
| Previous Weekly High | 95.55 |
| Previous Weekly Low | 93.65 |
| Previous Monthly High | 95.81 |
| Previous Monthly Low | 92.79 |
| Daily Fibonacci 38.2% | 95.27 |
| Daily Fibonacci 61.8% | 95.09 |
| Daily Pivot Point S1 | 94.76 |
| Daily Pivot Point S2 | 94.41 |
| Daily Pivot Point S3 | 94.02 |
| Daily Pivot Point R1 | 95.50 |
| Daily Pivot Point R2 | 95.90 |
| Daily Pivot Point R3 | 96.24 |
[/s2If]
Download Nehcap EAWe have two EAs that are operational on our LIVE accounts.
- EA-FIX: Check out the details here. Download EA-FIX . EA-FIX is a non-grid HFT scalper.
- EA-GROWTH: High quality low dd EA using trend grids. Download EA_GROWTHJoin Our Telegram Group
")


