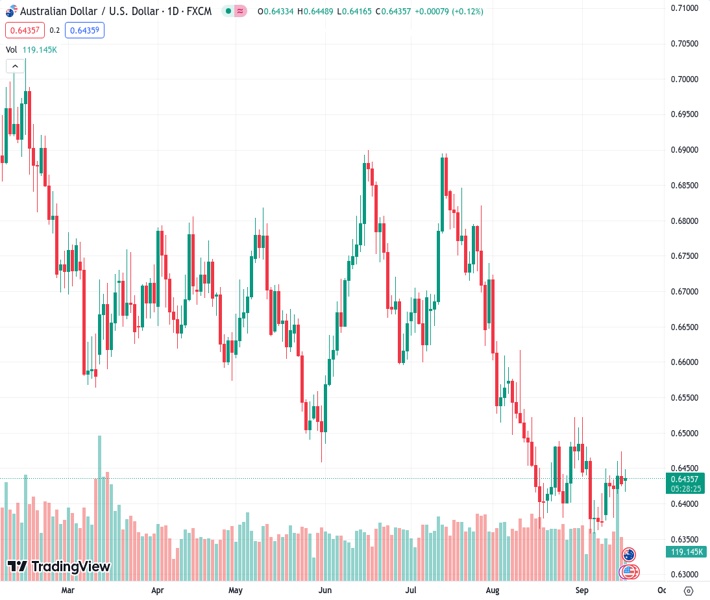
The Australian dollar to US dollar exchange rate, which was initially at 0.64317, has improved and is now trading at 0.6435. This recovery comes after reaching a low of 0.6416 earlier in the day, supported by positive Chinese economic data which has positively influenced market sentiment.
…
This is a premium post.
[s2If !current_user_can(access_s2member_level4)]Please register for FREE REGISTER to read full post below containing analysis. In case of any error or you think you are not able to read the full post below, please email us at support#nehcap.com [lwa][/s2If] [s2If current_user_can(access_s2member_level1)]
- AUD/USD trades at 0.6435, recovering from a daily low of 0.6416, as Chinese economic data boosts market sentiment.
The pair currently trades last at 0.64317.
The previous day high was 0.6474 while the previous day low was 0.6425. The daily 38.2% Fib levels comes at 0.6443, expected to provide resistance. Similarly, the daily 61.8% fib level is at 0.6455, expected to provide resistance.
The Australian Dollar (AUD) recovers some ground against the US Dollar (USD) as investors brace for a busy week in the central bank space, as the US Federal Reserve is expected to hold rates unchanged. Improvement in Chinese economic data, propelled by its government, cushioned the Aussie’s fall. The AUD/USD is trading at 0.6435 after hitting a daily low of 0.6416.
Market sentiment has improved due to Chinese data portraying a more optimistic outlook, which was threatened by deflation and a sudden economic slowdown. That boosted the Aussie Dollar (AUD), which is staging a recovery amid an absent economic docket.
Last week, the US economy witnessed an uptick in inflation on the consumer and producer side while the jobs market remains hot. Retail sales expanded slower than estimated but remained solid above the 2% threshold. Nevertheless, consumer sentiment slipped, blamed on elevated gasoline prices, as revealed by a University of Michigan poll (UoM).
A tranche of US housing data will be revealed ahead in the week, but all eyes are set on Jerome Powell and co. Money markets are not expecting a surprise by the Fed, with the odds of holding rates unchanged at 99%. Aside from the monetary policy statement, traders are looking for the ‘dot-plots’ to see Fed officials’ expectations regarding the Federal Funds Rate (FFR) path.
On the Australian front, the calendar would reveal the Judo Bank Services and Manufacturing PMIs alongside inflation data. However, the main highlight of the week is that Michelle Bullock is beginning her term as the new Reserve Bank of Australia (RBA) Governor.
Price action portrays the pair printed a hammer preceded by a slim uptrend, peaking at around last week’s high of 0.6475. However, if buyers clear that area, the pair could test 0.6500 and resume its upward direction to test the 50-day Moving Average (DMA) at 0.6551. Conversely, and in the most likely scenario, the AUD/USD could extend its losses, but first, sellers must drag prices below the 0.6400 mark. A breach of the latter, and the pair could slip towards the yearly lows of 0.6357.
Technical Levels: Supports and Resistances
AUDUSD currently trading at 0.6429 at the time of writing. Pair opened at 0.643 and is trading with a change of -0.02 % .
| Overview | Overview.1 | |
|---|---|---|
| 0 | Today last price | 0.6429 |
| 1 | Today Daily Change | -0.0001 |
| 2 | Today Daily Change % | -0.0200 |
| 3 | Today daily open | 0.6430 |
The pair remains strongly bearish on the daily time frame. It trades below the 20 SMA @ 0.6429, 50 SMA 0.6557, 100 SMA @ 0.6617 and 200 SMA @ 0.6705.
| Trends | Trends.1 | |
|---|---|---|
| 0 | Daily SMA20 | 0.6429 |
| 1 | Daily SMA50 | 0.6557 |
| 2 | Daily SMA100 | 0.6617 |
| 3 | Daily SMA200 | 0.6705 |
The previous day high was 0.6474 while the previous day low was 0.6425. The daily 38.2% Fib levels comes at 0.6443, expected to provide resistance. Similarly, the daily 61.8% fib level is at 0.6455, expected to provide resistance.
Note the levels of interest below:
- Pivot support is noted at 0.6412, 0.6394, 0.6363
- Pivot resistance is noted at 0.6461, 0.6491, 0.6509
| Levels | Levels.1 |
|---|---|
| Previous Daily High | 0.6474 |
| Previous Daily Low | 0.6425 |
| Previous Weekly High | 0.6474 |
| Previous Weekly Low | 0.6378 |
| Previous Monthly High | 0.6724 |
| Previous Monthly Low | 0.6364 |
| Daily Fibonacci 38.2% | 0.6443 |
| Daily Fibonacci 61.8% | 0.6455 |
| Daily Pivot Point S1 | 0.6412 |
| Daily Pivot Point S2 | 0.6394 |
| Daily Pivot Point S3 | 0.6363 |
| Daily Pivot Point R1 | 0.6461 |
| Daily Pivot Point R2 | 0.6491 |
| Daily Pivot Point R3 | 0.6509 |
[/s2If]
Download Nehcap EAWe have two EAs that are operational on our LIVE accounts.
- EA-FIX: Check out the details here. Download EA-FIX . EA-FIX is a non-grid HFT scalper.
- EA-GROWTH: High quality low dd EA using trend grids. Download EA_GROWTHJoin Our Telegram Group
")


