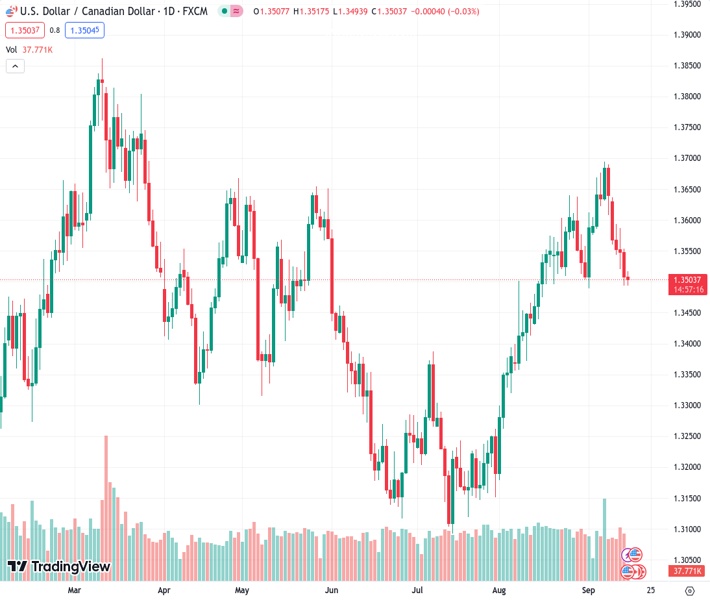
The USDCAD pair at an exchange rate of 1.35006 has enticed a group of sellers, causing it to remain in a decline for the sixth day in a row on Friday.
…
This is a premium post.
[s2If !current_user_can(access_s2member_level4)]Please register for FREE REGISTER to read full post below containing analysis. In case of any error or you think you are not able to read the full post below, please email us at support#nehcap.com [lwa][/s2If] [s2If current_user_can(access_s2member_level1)]
- USD/CAD attracts some sellers and trades in negative territory for the sixth consecutive day on Friday.
The pair currently trades last at 1.35006.
The previous day high was 1.3557 while the previous day low was 1.3493. The daily 38.2% Fib levels comes at 1.3518, expected to provide resistance. Similarly, the daily 61.8% fib level is at 1.3532, expected to provide resistance.
The USD/CAD pair extends its downside around the 1.3500 mark during the early European session on Friday. A rally in crude oil prices near the highest level since November 2022 boosts the commodity-linked Loonie against the US Dollar (USD) and acts as a headwind for the USD/CAD pair.
According to the one-hour chart, USD/CAD holds below the 50- and 100-hour Exponential Moving Averages (EMAs) with a downward slope, which supports the sellers for the time being. Additionally, the Relative Strength Index (RSI) stands below 50, activating the bearish momentum for the USD/CAD pair for pair.
The immediate resistance level for the pair is seen at 1.3530, representing the 50-hour EMA and the upper boundary of the Bollinger Band. Any follow-through buying above the latter will pave the way to 1.3553 (the 100-hour EMA). The additional upside filter to watch is near a high of September 13 at 1.3586, followed by a psychological round figure at 1.3600.
Looking at the downside, the 1.3490 acts as an initial support level for USD/CAD. The mentioned level portrays the lower limit of the Bollinger Band. A breach below the latter will see a drop to 1.3475 (a low of August 16). Further south, the next downside stop is located at 1.3445 (a low of August 15) en route to a low of August 11 at 1.3412.
Technical Levels: Supports and Resistances
USDCAD currently trading at 1.3497 at the time of writing. Pair opened at 1.3508 and is trading with a change of -0.08 % .
| Overview | Overview.1 | |
|---|---|---|
| 0 | Today last price | 1.3497 |
| 1 | Today Daily Change | -0.0011 |
| 2 | Today Daily Change % | -0.0800 |
| 3 | Today daily open | 1.3508 |
The pair is trading below its 20 Daily moving average @ 1.3576, above its 50 Daily moving average @ 1.3409 , above its 100 Daily moving average @ 1.3403 and above its 200 Daily moving average @ 1.3466
| Trends | Trends.1 | |
|---|---|---|
| 0 | Daily SMA20 | 1.3576 |
| 1 | Daily SMA50 | 1.3409 |
| 2 | Daily SMA100 | 1.3403 |
| 3 | Daily SMA200 | 1.3466 |
The previous day high was 1.3557 while the previous day low was 1.3493. The daily 38.2% Fib levels comes at 1.3518, expected to provide resistance. Similarly, the daily 61.8% fib level is at 1.3532, expected to provide resistance.
Note the levels of interest below:
- Pivot support is noted at 1.3482, 1.3456, 1.3419
- Pivot resistance is noted at 1.3546, 1.3583, 1.3609
| Levels | Levels.1 |
|---|---|
| Previous Daily High | 1.3557 |
| Previous Daily Low | 1.3493 |
| Previous Weekly High | 1.3694 |
| Previous Weekly Low | 1.3576 |
| Previous Monthly High | 1.3640 |
| Previous Monthly Low | 1.3184 |
| Daily Fibonacci 38.2% | 1.3518 |
| Daily Fibonacci 61.8% | 1.3532 |
| Daily Pivot Point S1 | 1.3482 |
| Daily Pivot Point S2 | 1.3456 |
| Daily Pivot Point S3 | 1.3419 |
| Daily Pivot Point R1 | 1.3546 |
| Daily Pivot Point R2 | 1.3583 |
| Daily Pivot Point R3 | 1.3609 |
[/s2If]
Download Nehcap EAWe have two EAs that are operational on our LIVE accounts.
- EA-FIX: Check out the details here. Download EA-FIX . EA-FIX is a non-grid HFT scalper.
- EA-GROWTH: High quality low dd EA using trend grids. Download EA_GROWTHJoin Our Telegram Group
")


