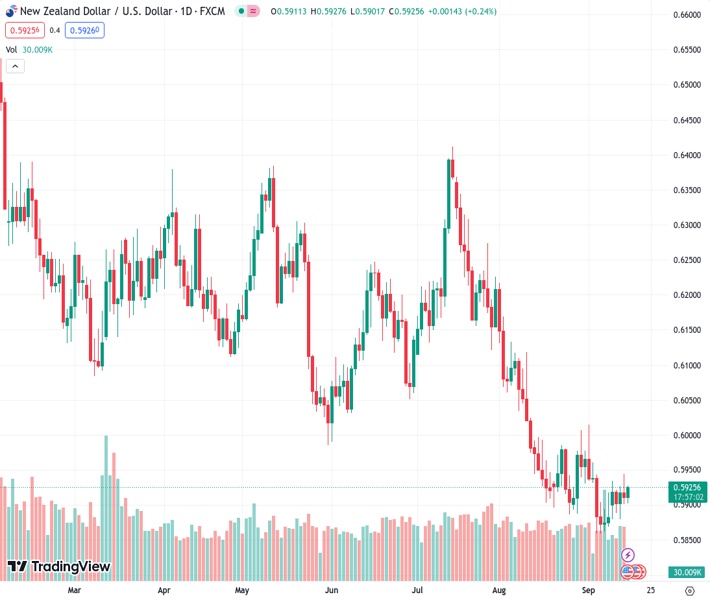
The NZDUSD pair has gained strength above the 0.5920 level after positive economic data from China.
…
This is a premium post.
[s2If !current_user_can(access_s2member_level4)]Please register for FREE REGISTER to read full post below containing analysis. In case of any error or you think you are not able to read the full post below, please email us at support#nehcap.com [lwa][/s2If] [s2If current_user_can(access_s2member_level1)]
- NZD/USD gains momentum above the 0.5920 mark following the upbeat Chinese data.
The pair currently trades last at 0.59259.
The previous day high was 0.5945 while the previous day low was 0.5901. The daily 38.2% Fib levels comes at 0.5918, expected to provide support. Similarly, the daily 61.8% fib level is at 0.5929, expected to provide resistance.
The NZD/USD pair reverses its course and surges to 0.5925 during the early Asian trading hours on Friday. The rebound in Kiwi is supported by the stronger-than-expected Chinese data.
The National Bureau of Statistics (NBS) revealed on Friday that Chinese Retail Sales for August rose by 4.6% YoY compared to the previous reading of 2.5%, above the market consensus. Meanwhile, the country’s Industrial Production improved to 4.5% in August from 3.7% in the previous month, beating the market expectation of 3.9%. Finally, the Fixed Asset Investment increased 3.2% YoY in August versus 3.4% prior, below the 3.3% expected. In response to the data, the China-proxy New Zealand (NZD) attracts some buyers and acts as a tailwind for the NZD/USD pair.
Apart from the data, the People’s Bank of China (PBOC) kept the one-year Medium-term Lending Facility (MLF) rate unchanged at 2.50% on Friday. Additionally, the PBOC maintained the seven-day reverse repo rate at 1.80% while lowering the 14-day reverse repo rate to 1.95% from 2.15% previously.
Furthermore, data released by Business NZ showed that the Business NZ PMI came in at 46.1 in August from 46.3 in the previous month. However, the Kiwi did not react to New Zealand’s data as the risk sentiment and USD dynamic influenced the pair for the time being.
On the USD’s front, the upbeat US data on Thursday indicate that the US economy remains resilient and inflation rebounded in August. The August Producer Price Index (PPI) grew more than expected, with the annual rate rising to 1.5% from 0.8%. The annual Core figure fell from 2.4% to 2.2%. Furthermore, Retail Sales grew by 0.6% MoM in August, beating estimations of 0.2%. Weekly Initial Jobless Claims increased by 220K from 217K, falling short of the market consensus of 225K.
The Federal Reserve’s (Fed) monetary policy expectations were not significantly altered by these figures. Markets anticipate that the Fed will maintain its interest rate at its meeting scheduled for next week, According to the CME FedWatch Tool, the Fed would not raise rates at its September meeting, but there is a 35% chance that rates will increase in November.
Moving on, market participants will monitor the US Empire State Manufacturing Index, Industrial Production, and the University of Michigan Consumer Confidence survey. These figures could give a clear direction to the NZD/USD pair.
Technical Levels: Supports and Resistances
NZDUSD currently trading at 0.5922 at the time of writing. Pair opened at 0.5912 and is trading with a change of 0.17 % .
| Overview | Overview.1 | |
|---|---|---|
| 0 | Today last price | 0.5922 |
| 1 | Today Daily Change | 0.0010 |
| 2 | Today Daily Change % | 0.1700 |
| 3 | Today daily open | 0.5912 |
The pair remains strongly bearish on the daily time frame. It trades below the 20 SMA @ 0.5923, 50 SMA 0.606, 100 SMA @ 0.6114 and 200 SMA @ 0.6202.
| Trends | Trends.1 | |
|---|---|---|
| 0 | Daily SMA20 | 0.5923 |
| 1 | Daily SMA50 | 0.6060 |
| 2 | Daily SMA100 | 0.6114 |
| 3 | Daily SMA200 | 0.6202 |
The previous day high was 0.5945 while the previous day low was 0.5901. The daily 38.2% Fib levels comes at 0.5918, expected to provide support. Similarly, the daily 61.8% fib level is at 0.5929, expected to provide resistance.
Note the levels of interest below:
- Pivot support is noted at 0.5894, 0.5876, 0.585
- Pivot resistance is noted at 0.5938, 0.5964, 0.5982
| Levels | Levels.1 |
|---|---|
| Previous Daily High | 0.5945 |
| Previous Daily Low | 0.5901 |
| Previous Weekly High | 0.5961 |
| Previous Weekly Low | 0.5847 |
| Previous Monthly High | 0.6219 |
| Previous Monthly Low | 0.5885 |
| Daily Fibonacci 38.2% | 0.5918 |
| Daily Fibonacci 61.8% | 0.5929 |
| Daily Pivot Point S1 | 0.5894 |
| Daily Pivot Point S2 | 0.5876 |
| Daily Pivot Point S3 | 0.5850 |
| Daily Pivot Point R1 | 0.5938 |
| Daily Pivot Point R2 | 0.5964 |
| Daily Pivot Point R3 | 0.5982 |
[/s2If]
Download Nehcap EAWe have two EAs that are operational on our LIVE accounts.
- EA-FIX: Check out the details here. Download EA-FIX . EA-FIX is a non-grid HFT scalper.
- EA-GROWTH: High quality low dd EA using trend grids. Download EA_GROWTHJoin Our Telegram Group
")


