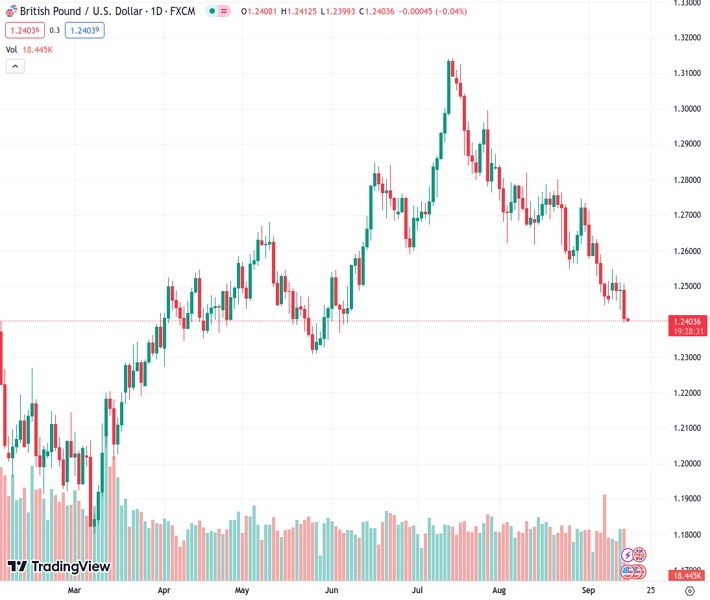
The GBPUSD pair trades slightly above 1.2400 in anticipation of the release of US consumer confidence data.
…
This is a premium post.
[s2If !current_user_can(access_s2member_level4)]Please register for FREE REGISTER to read full post below containing analysis. In case of any error or you think you are not able to read the full post below, please email us at support#nehcap.com [lwa][/s2If] [s2If current_user_can(access_s2member_level1)]
- GBP/USD hovers above 1.2400 ahead of US consumer confidence data.
The pair currently trades last at 1.24046.
The previous day high was 1.2506 while the previous day low was 1.2397. The daily 38.2% Fib levels comes at 1.2438, expected to provide resistance. Similarly, the daily 61.8% fib level is at 1.2464, expected to provide resistance.
GBP/USD struggles to snap the previous day’s loss, hovering around 1.2410 during the early trading hours of the Asian session on Friday. The pair is experiencing downward pressure after the better-than-expected economic figures from the United States (US).
On Thursday, the Core Producer Price Index (PPI) for August increased by 2.2% as expected, and below the previous rate of a 2.4% hike. Retail Sales improved to 0.6% against the previous month’s 0.5% readings and the market consensus of slowdown to 0.2%.
US Initial Jobless Claims for the week ending on September 8, printed the reading of 220K new claimants better than the forecast 225K. The previous week’s print was 217K.
However, the CME FedWatch Tool has reduced the probability to 35% that the US Federal Reserve (Fed) will implement a 25 basis points (bps) rate hike in November. Investors turn cautious regarding the potential for such a move as they evaluate the changing economic overview and Fed communications.
US Dollar Index (DXY), which compares the US Dollar (USD) against the six other major currencies, trading around its six-month highs marked on Thursday. The spot price is beating around 105.40 at the time of writing.
On the other side, the British Pound’s (GBP) risk appetite remains uncertain following Wednesday’s disappointing performance in the United Kingdom’s (UK) economic calendar.
UK Gross Domestic Product (GDP) data revealed a more severe decline than anticipated, as the July figures dropped by 0.5%, surpassing the expected 0.2% decrease and erasing the 0.5% gain from the previous month. This unexpected GDP contraction has added to the GBP’s volatility and market uncertainty.
The UK economy is grappling with a range of challenges stemming from the Bank of England’s (BoE) tight stance on interest rates. These challenges include exceptionally robust wage growth and a labor market where demand is showing signs of slowing down.
Consequently, the British economic forecast has become precarious as overall output is contracting amid a weakening demand environment. The probability of the UK economy slipping into a technical recession is elevated, given the BoE’s plans for additional interest rate hikes that are already in the works.
Market participants will likely watch the release of the US preliminary Michigan Consumer Sentiment Index on Friday. This index is expected to register a slight drop from a reading of 69.1 to 69.5. If the actual reading aligns with or exceeds these expectations, it has the potential to provide the Greenback with the momentum required to continue its upward trajectory.
Technical Levels: Supports and Resistances
GBPUSD currently trading at 1.2412 at the time of writing. Pair opened at 1.2409 and is trading with a change of 0.02 % .
| Overview | Overview.1 | |
|---|---|---|
| 0 | Today last price | 1.2412 |
| 1 | Today Daily Change | 0.0003 |
| 2 | Today Daily Change % | 0.0200 |
| 3 | Today daily open | 1.2409 |
The pair remains strongly bearish on the daily time frame. It trades below the 20 SMA @ 1.2595, 50 SMA 1.2742, 100 SMA @ 1.2655 and 200 SMA @ 1.2432.
| Trends | Trends.1 | |
|---|---|---|
| 0 | Daily SMA20 | 1.2595 |
| 1 | Daily SMA50 | 1.2742 |
| 2 | Daily SMA100 | 1.2655 |
| 3 | Daily SMA200 | 1.2432 |
The previous day high was 1.2506 while the previous day low was 1.2397. The daily 38.2% Fib levels comes at 1.2438, expected to provide resistance. Similarly, the daily 61.8% fib level is at 1.2464, expected to provide resistance.
Note the levels of interest below:
- Pivot support is noted at 1.2368, 1.2328, 1.2259
- Pivot resistance is noted at 1.2478, 1.2547, 1.2587
| Levels | Levels.1 |
|---|---|
| Previous Daily High | 1.2506 |
| Previous Daily Low | 1.2397 |
| Previous Weekly High | 1.2643 |
| Previous Weekly Low | 1.2446 |
| Previous Monthly High | 1.2841 |
| Previous Monthly Low | 1.2548 |
| Daily Fibonacci 38.2% | 1.2438 |
| Daily Fibonacci 61.8% | 1.2464 |
| Daily Pivot Point S1 | 1.2368 |
| Daily Pivot Point S2 | 1.2328 |
| Daily Pivot Point S3 | 1.2259 |
| Daily Pivot Point R1 | 1.2478 |
| Daily Pivot Point R2 | 1.2547 |
| Daily Pivot Point R3 | 1.2587 |
[/s2If]
Download Nehcap EAWe have two EAs that are operational on our LIVE accounts.
- EA-FIX: Check out the details here. Download EA-FIX . EA-FIX is a non-grid HFT scalper.
- EA-GROWTH: High quality low dd EA using trend grids. Download EA_GROWTHJoin Our Telegram Group
")


