The AUDUSD pair is experiencing difficulty in continuing its recovery as the US Dollar strengthens.
…
This is a premium post.
[s2If !current_user_can(access_s2member_level4)]Please register for FREE REGISTER to read full post below containing analysis. In case of any error or you think you are not able to read the full post below, please email us at support#nehcap.com [lwa][/s2If] [s2If current_user_can(access_s2member_level1)]
- AUD/USD faces pressure in extending recovery as the US Dollar rebounds.
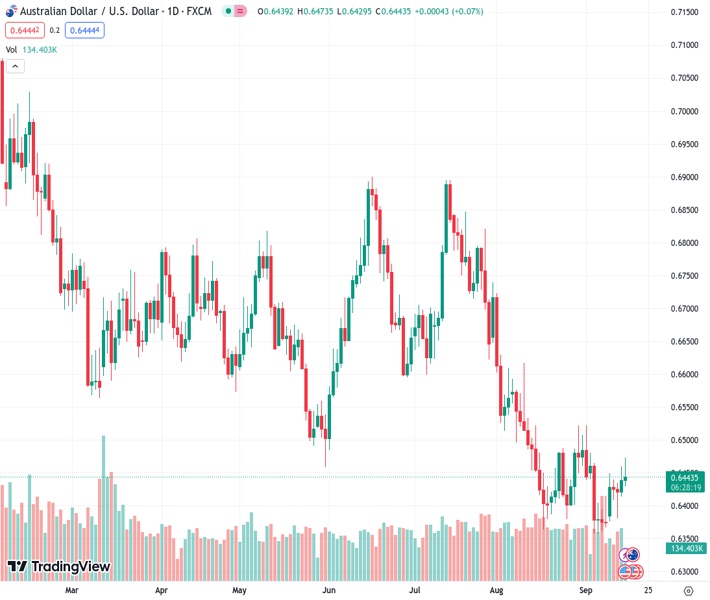
The pair currently trades last at 0.64444.
The previous day high was 0.646 while the previous day low was 0.6416. The daily 38.2% Fib levels comes at 0.6443, expected to provide support. Similarly, the daily 61.8% fib level is at 0.6433, expected to provide support.
The AUD/USD pair retreats after failing to extend recovery above the immediate resistance of 0.6470 as the US Dollar resumes its upside journey after a mild correction in the early New York session. The Aussie asset fails to stretch recovery further despite robust China’s economic data.
China’s annual Industrial Production remained robust in August, rose by 4.5%, and Retail Sales expanded by 4.6%. Investors feel that one-time robust economic data is insufficient to warrant decent growth prospects. The Australian Dollar, being a proxy to the Chinese economy, is facing tough barriers.
The US Dollar Index remains inside the woods but is expected to renew its six-month high despite expectations of a steady interest rate decision by the Federal Reserve (Fed) next week.
Meanwhile, the US Michigan Consumer Sentiment Index (CSI) drops to 67.7 as investors worry about the economic outlook knowing that the Fed is expected to keep interest rates high long enough’ till inflation comes down to 2%.
AUD/USD recovers after discovering buying interest while re-testing the horizontal support plotted from August 17 low at 0.6365. The Aussie asset climbs above the 50-period Exponential Moving Average (EMA), which trades around 0.6433. Potential resistance is plotted from August 30 high at 0.6522.
The Relative Strength Index (RSI) (14) aims to shift into the bullish range of 60.00-80.00. An occurrence of the same will activate the upside momentum.
A decisive break above August 15 high around 0.6522 will drive the asset to August 9 high at 0.6571. Breach of the latter will drive the asset towards August 10 high at 0.6616.
On the flip side, fresh downside would appear if the Aussie asset will drop below August 17 low around 0.6360. This would expose the asset to the round-level support of 0.6300 followed by 03 November 2022 low at 0.6272.
Technical Levels: Supports and Resistances
AUDUSD currently trading at 0.6446 at the time of writing. Pair opened at 0.644 and is trading with a change of 0.09 % .
| Overview | Overview.1 | |
|---|---|---|
| 0 | Today last price | 0.6446 |
| 1 | Today Daily Change | 0.0006 |
| 2 | Today Daily Change % | 0.0900 |
| 3 | Today daily open | 0.6440 |
The pair is trading above its 20 Daily moving average @ 0.6428, below its 50 Daily moving average @ 0.6562 , below its 100 Daily moving average @ 0.6619 and below its 200 Daily moving average @ 0.6707
| Trends | Trends.1 | |
|---|---|---|
| 0 | Daily SMA20 | 0.6428 |
| 1 | Daily SMA50 | 0.6562 |
| 2 | Daily SMA100 | 0.6619 |
| 3 | Daily SMA200 | 0.6707 |
The previous day high was 0.646 while the previous day low was 0.6416. The daily 38.2% Fib levels comes at 0.6443, expected to provide support. Similarly, the daily 61.8% fib level is at 0.6433, expected to provide support.
Note the levels of interest below:
- Pivot support is noted at 0.6417, 0.6395, 0.6373
- Pivot resistance is noted at 0.6462, 0.6483, 0.6506
| Levels | Levels.1 |
|---|---|
| Previous Daily High | 0.6460 |
| Previous Daily Low | 0.6416 |
| Previous Weekly High | 0.6480 |
| Previous Weekly Low | 0.6357 |
| Previous Monthly High | 0.6724 |
| Previous Monthly Low | 0.6364 |
| Daily Fibonacci 38.2% | 0.6443 |
| Daily Fibonacci 61.8% | 0.6433 |
| Daily Pivot Point S1 | 0.6417 |
| Daily Pivot Point S2 | 0.6395 |
| Daily Pivot Point S3 | 0.6373 |
| Daily Pivot Point R1 | 0.6462 |
| Daily Pivot Point R2 | 0.6483 |
| Daily Pivot Point R3 | 0.6506 |
[/s2If]
Download Nehcap EAWe have two EAs that are operational on our LIVE accounts.
- EA-FIX: Check out the details here. Download EA-FIX . EA-FIX is a non-grid HFT scalper.
- EA-GROWTH: High quality low dd EA using trend grids. Download EA_GROWTHJoin Our Telegram Group
")


