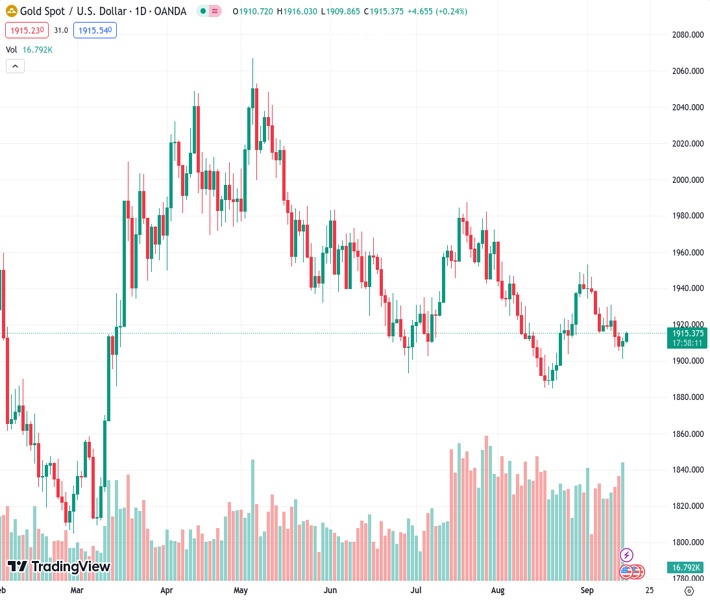
Gold is seeing improvement for the second consecutive day, with its price of $1,915.54 rising and distancing itself from a low that lasted several weeks.
…
This is a premium post.
[s2If !current_user_can(access_s2member_level4)]Please register for FREE REGISTER to read full post below containing analysis. In case of any error or you think you are not able to read the full post below, please email us at support#nehcap.com [lwa][/s2If] [s2If current_user_can(access_s2member_level1)]
- Gold gains positive traction for the second straight day and moves away from a multi-week low.
The pair currently trades last at 1915.54.
The previous day high was 1912.95 while the previous day low was 1901.07. The daily 38.2% Fib levels comes at 1908.41, expected to provide support. Similarly, the daily 61.8% fib level is at 1905.61, expected to provide support.
Gold price builds on the previous day’s goodish bounce from the $1,900 mark, or over a three-week low and gains some follow-through traction, for the second successive day on Friday. The momentum lifts the XAU/USD to a three-day peak, around the $1,915-$1,916 region during the Asian session, though any meaningful appreciating move still seems elusive.
The US Dollar (USD) pulls back from its highest level since March touched on Thursday and is seen as a key factor driving some flows towards the US Dollar-denominated Gold price. The USD downtick could be attributed to some profit-taking amid a mildly softer tone surrounding the United States (US) government bond yields. That said, firming expectations that the Federal Reserve (Fed) will keep interest rates higher for longer should act as a tailwind for the US bond yields and the Greenback.
The incoming stronger US macro data continue to point to an extremely resilient economy and support prospects for further policy tightening by the Fed. The US Census Bureau reported on Thursday that Retail Sales increased by 0.6% in August, outperforming expectations for a 0.2% rise and the previous month’s downwardly revised reading of 0.5%. Adding to this, the US Initial Jobless Claims rose less than expected, to 220K during the second week of September as compared to the 217K previous.
The US Bureau of Labor Statistics published the US Producer Price Index (PPI), which accelerated to 0.7% in August from the 0.4% previous and the annual rate climbed to 1.6%, faster than projections of 1.2% and 0.8% in July. This comes on top of the US CPI report released on Wednesday and points to a still-sticky inflation, which should allow the Fed to stick to its hawkish stance. The hawkish outlook favours the USD bulls and should keep a lid on any meaningful gains for the non-yielding Gold price.
Apart from this, a generally positive risk tone, bolstered by more stimulus from China, might further contribute to capping the upside for the safe-haven precious metal. Investors turned optimistic after the People’s Bank of China (PBoC) lowered its Reserve Requirement Ratio for much of the banking system by 25 bps – its second such move this year. This is expected to release more liquidity and potentially shore up growth in the world’s second-largest economy, easing recession fears.
The aforementioned fundamental backdrop, along with the recent breakdown through a technically significant 200-day Simple Moving Average (SMA), suggests that the path of least resistance for the Gold price is to the downside. Hence, any subsequent move up might still be seen as a selling opportunity and runs the risk of fizzling out rather quickly. Traders now look to the US economic docket, featuring the Empire State Manufacturing Index and Prelim Michigan Consumer Sentiment Index.
Technical Levels: Supports and Resistances
XAUUSD currently trading at 1915.83 at the time of writing. Pair opened at 1910.79 and is trading with a change of 0.26 % .
| Overview | Overview.1 | |
|---|---|---|
| 0 | Today last price | 1915.83 |
| 1 | Today Daily Change | 5.04 |
| 2 | Today Daily Change % | 0.26 |
| 3 | Today daily open | 1910.79 |
The pair remains strongly bearish on the daily time frame. It trades below the 20 SMA @ 1919.22, 50 SMA 1931.85, 100 SMA @ 1947.57 and 200 SMA @ 1921.54.
| Trends | Trends.1 | |
|---|---|---|
| 0 | Daily SMA20 | 1919.22 |
| 1 | Daily SMA50 | 1931.85 |
| 2 | Daily SMA100 | 1947.57 |
| 3 | Daily SMA200 | 1921.54 |
The previous day high was 1912.95 while the previous day low was 1901.07. The daily 38.2% Fib levels comes at 1908.41, expected to provide support. Similarly, the daily 61.8% fib level is at 1905.61, expected to provide support.
Note the levels of interest below:
- Pivot support is noted at 1903.59, 1896.39, 1891.71
- Pivot resistance is noted at 1915.47, 1920.15, 1927.35
| Levels | Levels.1 |
|---|---|
| Previous Daily High | 1912.95 |
| Previous Daily Low | 1901.07 |
| Previous Weekly High | 1946.35 |
| Previous Weekly Low | 1915.33 |
| Previous Monthly High | 1966.08 |
| Previous Monthly Low | 1884.85 |
| Daily Fibonacci 38.2% | 1908.41 |
| Daily Fibonacci 61.8% | 1905.61 |
| Daily Pivot Point S1 | 1903.59 |
| Daily Pivot Point S2 | 1896.39 |
| Daily Pivot Point S3 | 1891.71 |
| Daily Pivot Point R1 | 1915.47 |
| Daily Pivot Point R2 | 1920.15 |
| Daily Pivot Point R3 | 1927.35 |
[/s2If]
Download Nehcap EAWe have two EAs that are operational on our LIVE accounts.
- EA-FIX: Check out the details here. Download EA-FIX . EA-FIX is a non-grid HFT scalper.
- EA-GROWTH: High quality low dd EA using trend grids. Download EA_GROWTHJoin Our Telegram Group
")


