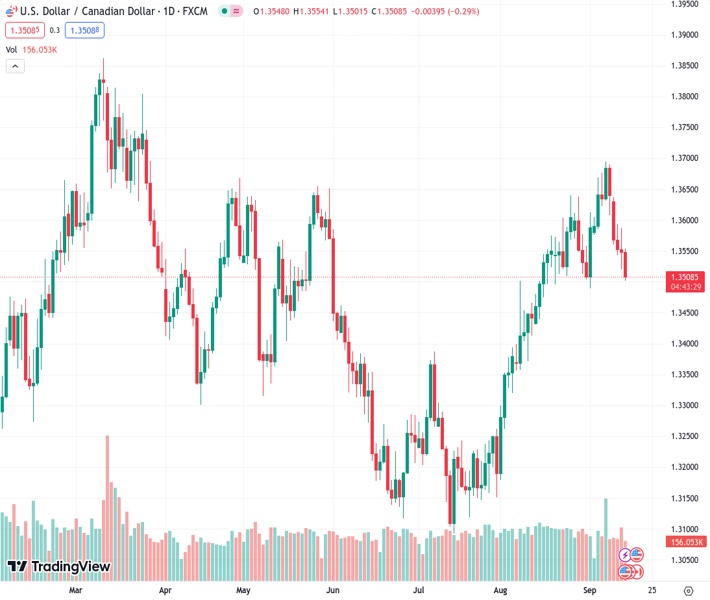
USDCAD recorded its fifth consecutive day of declines, reaching a level of 1.3515.
…
This is a premium post.
[s2If !current_user_can(access_s2member_level4)]Please register for FREE REGISTER to read full post below containing analysis. In case of any error or you think you are not able to read the full post below, please email us at support#nehcap.com [lwa][/s2If] [s2If current_user_can(access_s2member_level1)]
- USD/CAD tallied its fifth day in a row of losses of 1.3515.
The pair currently trades last at 1.35094.
The previous day high was 1.3587 while the previous day low was 1.3521. The daily 38.2% Fib levels comes at 1.3546, expected to provide resistance. Similarly, the daily 61.8% fib level is at 1.3562, expected to provide resistance.
On Thursday’s session, the USD/CAD continued its downward path, failing nearly to 1.3510, seeing 0.30% losses. On the CAD’s side, its strength may be explained by higher Oil prices as Canada is a leading exporter, while the USD measure by the DXY index rose to fresh highs around 105.20 after the release of mid-tier data. In line with that, the downside may be limited for the pair.
On the data front, the Greenback gained momentum after it was reported that Retail Sales rose 0.6% MoM in August, much better than the 0.2% anticipated and higher than the previous 0.6%. In addition, the Producer Price Index (PPI) jumped from 0.7% MoM to 1.6% YoY in August, also beating expectations. Moreover, Jobless Claims for the second week of September accelerated but below the expectations at 220,000, higher than the previous weekly reading of 217,000 but below the expected 225,000.
As a reaction, US Treasury yields advanced with the news, with the 2-year note offering nearly 5% and boosting demand for the American dollar, whose DXY index continues to trade at highs since early March. On the expectations front, the CME FedWatch tool suggests that the odds of one last hike in 2023 by the Federal Reserve (Fed) declined to nearly 35% from 40% in the previous sessions. Attention now turns to next week’s decision, where markets have already priced in a pause, but the statement and Chair Powell’s presser will be closely monitored.
The short-term view for USD/CAD suggests a bearish outlook based on the daily chart analysis. The Relative Strength Index (RSI) is positioned below its midline and displays a southward slope, while the Moving Average Convergence Divergence (MACD) exhibits red bars, signalling an increasing bearish momentum. On the other hand, the pair is below the 20-day Simple Moving Average (SMA) but above the 100 and 200-day SMAs, pointing towards the prevailing strength of the bulls in the larger context.
Support levels: 1.3500, 1.3490, 1.3463 (200-day SMA).
Resistance levels: 1.3576 (20-day SMA), 1.3600, 1.3630.
Technical Levels: Supports and Resistances
USDCAD currently trading at 1.3513 at the time of writing. Pair opened at 1.3549 and is trading with a change of -0.27 % .
| Overview | Overview.1 | |
|---|---|---|
| 0 | Today last price | 1.3513 |
| 1 | Today Daily Change | -0.0036 |
| 2 | Today Daily Change % | -0.2700 |
| 3 | Today daily open | 1.3549 |
The pair is trading below its 20 Daily moving average @ 1.3578, above its 50 Daily moving average @ 1.3406 , above its 100 Daily moving average @ 1.3404 and above its 200 Daily moving average @ 1.3466
| Trends | Trends.1 | |
|---|---|---|
| 0 | Daily SMA20 | 1.3578 |
| 1 | Daily SMA50 | 1.3406 |
| 2 | Daily SMA100 | 1.3404 |
| 3 | Daily SMA200 | 1.3466 |
The previous day high was 1.3587 while the previous day low was 1.3521. The daily 38.2% Fib levels comes at 1.3546, expected to provide resistance. Similarly, the daily 61.8% fib level is at 1.3562, expected to provide resistance.
Note the levels of interest below:
- Pivot support is noted at 1.3518, 1.3486, 1.3451
- Pivot resistance is noted at 1.3584, 1.3619, 1.365
| Levels | Levels.1 |
|---|---|
| Previous Daily High | 1.3587 |
| Previous Daily Low | 1.3521 |
| Previous Weekly High | 1.3694 |
| Previous Weekly Low | 1.3576 |
| Previous Monthly High | 1.3640 |
| Previous Monthly Low | 1.3184 |
| Daily Fibonacci 38.2% | 1.3546 |
| Daily Fibonacci 61.8% | 1.3562 |
| Daily Pivot Point S1 | 1.3518 |
| Daily Pivot Point S2 | 1.3486 |
| Daily Pivot Point S3 | 1.3451 |
| Daily Pivot Point R1 | 1.3584 |
| Daily Pivot Point R2 | 1.3619 |
| Daily Pivot Point R3 | 1.3650 |
[/s2If]
Download Nehcap EAWe have two EAs that are operational on our LIVE accounts.
- EA-FIX: Check out the details here. Download EA-FIX . EA-FIX is a non-grid HFT scalper.
- EA-GROWTH: High quality low dd EA using trend grids. Download EA_GROWTHJoin Our Telegram Group
")


