The USDJPY currency pair, trading at a rate of 147.093, faces a decrease in momentum as it approaches the level of 147.12 due to the US Dollar becoming weaker.
…
This is a premium post.
[s2If !current_user_can(access_s2member_level4)]Please register for FREE REGISTER to read full post below containing analysis. In case of any error or you think you are not able to read the full post below, please email us at support#nehcap.com [lwa][/s2If] [s2If current_user_can(access_s2member_level1)]
- USD/JPY loses momentum near 147.12 amid the weakening of the US Dollar.
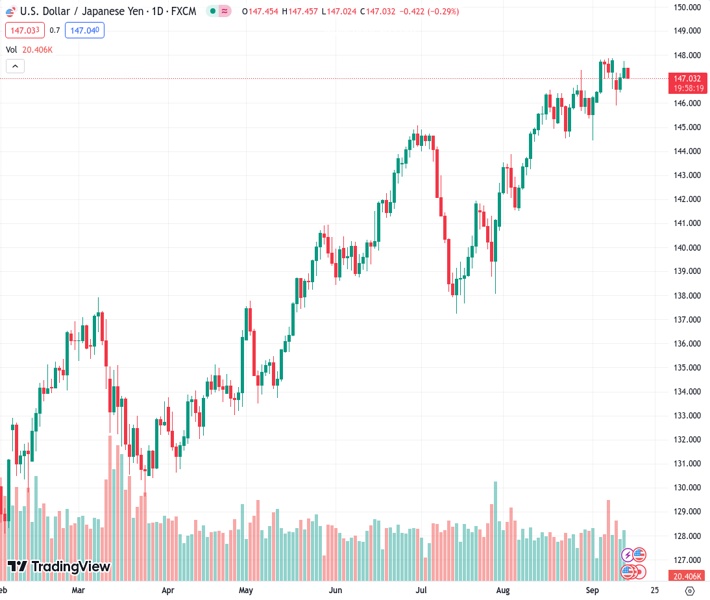
The pair currently trades last at 147.093.
The previous day high was 147.74 while the previous day low was 147.02. The daily 38.2% Fib levels comes at 147.47, expected to provide resistance. Similarly, the daily 61.8% fib level is at 147.29, expected to provide resistance.
The USD/JPY pair loses traction to below the mid 147.00s during the early Asian session on Thursday. The weakening of the US Dollar (USD) drags the USD/JPY pair lower and the pair currently trades near 147.12, down 0.23% on the day.
US Bureau of Labor Statistics revealed on Wednesday that the August headline inflation was the highest monthly gain in 14 months with the US Consumer Price Index (CPI) rising 0.6% MoM from 0.2% in the previous reading. Meanwhile, the annual figure came in at 3.7% from 3.2%, beating market expectations. The core CPI, which excludes volatile food and energy prices surges 0.3% MoM from 0.2% in July. The annual core CPI came in at 4.3% versus 4.7% prior.
In response to the data, the US Dollar (USD) surged and later lost traction as the markets anticipate that interest rates will remain unchanged at next week’s FOMC meeting. However, the figures imply that the Fed should be on the lookout for any re-acceleration in inflation in the next months. Investors have priced in 97% odds of interest rate unchanged in September at 5.25%-5.50%. However, the possibility of a rate hike in the November meeting increased to 49.2%, according to the CME Fedwatch Tool.
On the Japanese Yen front, market participants are pricing a massive shift in Bank of Japan’s (BoJ) monetary policy outlook following the hawkish comments from BoJ Governor Kazuo Ueda delivered over the weekend. BoJ Governor Ueda stated on Monday in an interview that the central bank could exit its negative interest rate policy when its inflation target of 2% is near and they would have sufficient evidence by the end of the year to evaluate whether interest rates should stay negative. Furthermore, Japanese Finance Minister Shunichi Suzuki said on Wednesday that he will strive to conduct debt management appropriately.
About the data, the Cabinet Office showed on Thursday that Japan’s Machinery Orders fell 13% in July from a 5.8% drop in the previous month. On a monthly basis, the figure dropped 1.1% from a 2.7% rise in June. Both figures came in below the market consensus.
Moving on, traders will keep an eye on the US Initial Jobless Claims, the Producer Price Index (PPI), and Retail Sales due on Thursday. Traders will take cues from these figures and find trading opportunities around the USD/JPY cross.
Technical Levels: Supports and Resistances
USDJPY currently trading at 147.12 at the time of writing. Pair opened at 147.46 and is trading with a change of -0.23 % .
| Overview | Overview.1 | |
|---|---|---|
| 0 | Today last price | 147.12 |
| 1 | Today Daily Change | -0.34 |
| 2 | Today Daily Change % | -0.23 |
| 3 | Today daily open | 147.46 |
The pair remains strongly bullish on the daily timeframe. It trades above its 20 SMA @ 146.45, 50 SMA 143.69, 100 SMA @ 141.57 and 200 SMA @ 137.24.
| Trends | Trends.1 | |
|---|---|---|
| 0 | Daily SMA20 | 146.45 |
| 1 | Daily SMA50 | 143.69 |
| 2 | Daily SMA100 | 141.57 |
| 3 | Daily SMA200 | 137.24 |
The previous day high was 147.74 while the previous day low was 147.02. The daily 38.2% Fib levels comes at 147.47, expected to provide resistance. Similarly, the daily 61.8% fib level is at 147.29, expected to provide resistance.
Note the levels of interest below:
- Pivot support is noted at 147.07, 146.68, 146.34
- Pivot resistance is noted at 147.8, 148.13, 148.52
| Levels | Levels.1 |
|---|---|
| Previous Daily High | 147.74 |
| Previous Daily Low | 147.02 |
| Previous Weekly High | 147.88 |
| Previous Weekly Low | 146.02 |
| Previous Monthly High | 147.38 |
| Previous Monthly Low | 141.51 |
| Daily Fibonacci 38.2% | 147.47 |
| Daily Fibonacci 61.8% | 147.29 |
| Daily Pivot Point S1 | 147.07 |
| Daily Pivot Point S2 | 146.68 |
| Daily Pivot Point S3 | 146.34 |
| Daily Pivot Point R1 | 147.80 |
| Daily Pivot Point R2 | 148.13 |
| Daily Pivot Point R3 | 148.52 |
[/s2If]
Download Nehcap EAWe have two EAs that are operational on our LIVE accounts.
- EA-FIX: Check out the details here. Download EA-FIX . EA-FIX is a non-grid HFT scalper.
- EA-GROWTH: High quality low dd EA using trend grids. Download EA_GROWTHJoin Our Telegram Group
")


