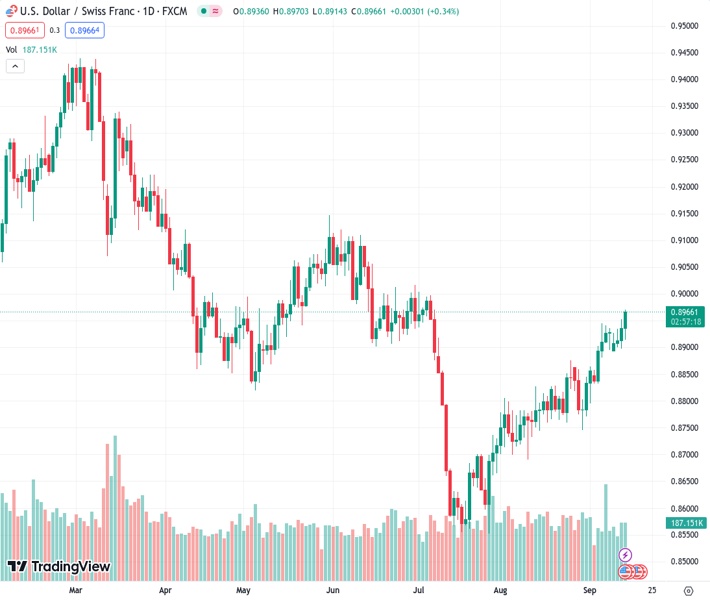
The USDCHF pair is currently experiencing a significant upward movement on the daily chart. It is expected to aim for a crucial resistance level at 0.9000.
…
This is a premium post.
[s2If !current_user_can(access_s2member_level4)]Please register for FREE REGISTER to read full post below containing analysis. In case of any error or you think you are not able to read the full post below, please email us at support#nehcap.com [lwa][/s2If] [s2If current_user_can(access_s2member_level1)]
- USD/CHF in a strong uptrend on the daily chart, targeting key resistance at 0.9000.
The pair currently trades last at 0.89660.
The previous day high was 0.8952 while the previous day low was 0.8907. The daily 38.2% Fib levels comes at 0.8935, expected to provide support. Similarly, the daily 61.8% fib level is at 0.8924, expected to provide support.
The US Dollar (USD) prolonged its gains versus the Swiss Franc (CHF) on Thursday, as the Greenback (USD) prints a six-month high, as inflation data during the last couple of days shows inflation remains elevated. Nevertheless, money market futures do not foresee a rate hike in September, but November remains open. Hence, the USD/CHF is trading at 0.8964 after hitting a daily low of 0.8914.
The daily chart depicts the pair as in a steady uptrend, with USD/CHF buyers eyeing the 0.9000 mark. A breach of the latter would expose the 200-day Moving Average (DMA) at 0.9041 before the major reaches the May 31 daily high at 0.9147. On the other hand, sellers must drag prices below the current week’s low of 0.8893 if they want to reclaim control.
The USD/CHF is set to test the 0.9000 mark in the short term, but buyers must first reclaim the R1 daily pivot at 0.8960. if that level is surpassed, the pair will aim toward the R2 pivot point at 0.8985 before claiming 0.9000. Conversely, the major would shift downwards if it drops below today’s daily low of 0.8914.
Technical Levels: Supports and Resistances
USDCHF currently trading at 0.8961 at the time of writing. Pair opened at 0.8937 and is trading with a change of 0.27 % .
| Overview | Overview.1 | |
|---|---|---|
| 0 | Today last price | 0.8961 |
| 1 | Today Daily Change | 0.0024 |
| 2 | Today Daily Change % | 0.2700 |
| 3 | Today daily open | 0.8937 |
The pair is trading above its 20 Daily moving average @ 0.8852, above its 50 Daily moving average @ 0.8774 , above its 100 Daily moving average @ 0.888 and below its 200 Daily moving average @ 0.9046
| Trends | Trends.1 | |
|---|---|---|
| 0 | Daily SMA20 | 0.8852 |
| 1 | Daily SMA50 | 0.8774 |
| 2 | Daily SMA100 | 0.8880 |
| 3 | Daily SMA200 | 0.9046 |
The previous day high was 0.8952 while the previous day low was 0.8907. The daily 38.2% Fib levels comes at 0.8935, expected to provide support. Similarly, the daily 61.8% fib level is at 0.8924, expected to provide support.
Note the levels of interest below:
- Pivot support is noted at 0.8912, 0.8887, 0.8867
- Pivot resistance is noted at 0.8957, 0.8977, 0.9002
| Levels | Levels.1 |
|---|---|
| Previous Daily High | 0.8952 |
| Previous Daily Low | 0.8907 |
| Previous Weekly High | 0.8945 |
| Previous Weekly Low | 0.8833 |
| Previous Monthly High | 0.8876 |
| Previous Monthly Low | 0.8690 |
| Daily Fibonacci 38.2% | 0.8935 |
| Daily Fibonacci 61.8% | 0.8924 |
| Daily Pivot Point S1 | 0.8912 |
| Daily Pivot Point S2 | 0.8887 |
| Daily Pivot Point S3 | 0.8867 |
| Daily Pivot Point R1 | 0.8957 |
| Daily Pivot Point R2 | 0.8977 |
| Daily Pivot Point R3 | 0.9002 |
[/s2If]
Download Nehcap EAWe have two EAs that are operational on our LIVE accounts.
- EA-FIX: Check out the details here. Download EA-FIX . EA-FIX is a non-grid HFT scalper.
- EA-GROWTH: High quality low dd EA using trend grids. Download EA_GROWTHJoin Our Telegram Group
")


