The US dollar to Mexican peso exchange rate of 17.1257 has decreased following the release of US Consumer Price Index data on Wednesday.
…
This is a premium post.
[s2If !current_user_can(access_s2member_level4)]Please register for FREE REGISTER to read full post below containing analysis. In case of any error or you think you are not able to read the full post below, please email us at support#nehcap.com [lwa][/s2If] [s2If current_user_can(access_s2member_level1)]
- USD/MXN trades lower after the release of US CPI data on Wednesday.
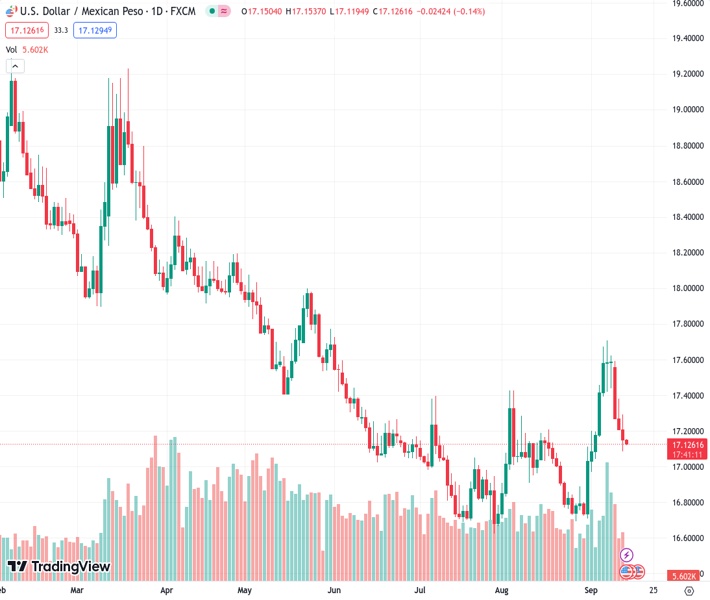
The pair currently trades last at 17.1257.
The previous day high was 17.2934 while the previous day low was 17.088. The daily 38.2% Fib levels comes at 17.1664, expected to provide resistance. Similarly, the daily 61.8% fib level is at 17.2149, expected to provide resistance.
USD/MXN continues the losing streak that began on Friday, trading lower around 17.1300 during the Asian session on Thursday. The pair is facing downward pressure following the release of the Consumer Price Index (CPI) data from the United States (US).
The data suggest the overall inflation may be moderating, the core rate, which excludes volatile components, remains relatively stable. The annual core rate met expectations by registering a reading of 4.3%, consistent with the previous figure of 4.7%.
However, the US CPI year-over-year rose to 3.7%, surpassing the previous rate of 3.2%, and it exceeded market expectations of 3.6% for August. Additionally, the monthly core CPI improved, increasing to 0.3% from the previous 0.2% for the same month. This uptick was unexpected, as it had been anticipated to remain unchanged.
Investor expectations have improved toward no interest rate hike by the US Federal Reserve (Fed) in the upcoming September policy meeting. The CME FedWatch Tool suggests that the Fed is likely to keep interest rates within the range of 5.25% to 5.50% for the September meeting.
Nevertheless, the likelihood of a 25 basis points (bps) rate hike in November remains at 40%, indicating growing expectations of the Fed implementing a tightening monetary policy later in the year. This suggests that while there might not be an immediate rate hike in September, investors anticipate the possibility of such a move in the near future.
US Dollar Index (DXY), which gauges the performance of the US Dollar (USD) against a basket of the other major six currencies, attempting to pull back from the gains it achieved the previous day. The spot price is trading lower around 104.70 by the press time.
DXY received upward support on Wednesday primarily due to the initial surge in US Treasury yields. However, it subsequently retraced, and the 10-year US bond yields traded at 4.23% at the time of writing.
Market participants are currently focusing on upcoming data releases from the US, including the Core Producer Price Index (PPI) and Retail Sales figures for August. These datasets will serve as important indicators of economic activities in the US.
The data can provide valuable insights into the state of the US economy and potentially influence currency market sentiment, helping traders formulate their strategies when trading the USD/MXN pair.
Technical Levels: Supports and Resistances
USDMXN currently trading at 17.137 at the time of writing. Pair opened at 17.1528 and is trading with a change of -0.09 % .
| Overview | Overview.1 | |
|---|---|---|
| 0 | Today last price | 17.1370 |
| 1 | Today Daily Change | -0.0158 |
| 2 | Today Daily Change % | -0.0900 |
| 3 | Today daily open | 17.1528 |
The pair is trading above its 20 Daily moving average @ 17.0973, above its 50 Daily moving average @ 17.0189 , below its 100 Daily moving average @ 17.2518 and below its 200 Daily moving average @ 17.9822
| Trends | Trends.1 | |
|---|---|---|
| 0 | Daily SMA20 | 17.0973 |
| 1 | Daily SMA50 | 17.0189 |
| 2 | Daily SMA100 | 17.2518 |
| 3 | Daily SMA200 | 17.9822 |
The previous day high was 17.2934 while the previous day low was 17.088. The daily 38.2% Fib levels comes at 17.1664, expected to provide resistance. Similarly, the daily 61.8% fib level is at 17.2149, expected to provide resistance.
Note the levels of interest below:
- Pivot support is noted at 17.0627, 16.9726, 16.8573
- Pivot resistance is noted at 17.2681, 17.3834, 17.4735
| Levels | Levels.1 |
|---|---|
| Previous Daily High | 17.2934 |
| Previous Daily Low | 17.0880 |
| Previous Weekly High | 17.7094 |
| Previous Weekly Low | 17.0447 |
| Previous Monthly High | 17.4274 |
| Previous Monthly Low | 16.6945 |
| Daily Fibonacci 38.2% | 17.1664 |
| Daily Fibonacci 61.8% | 17.2149 |
| Daily Pivot Point S1 | 17.0627 |
| Daily Pivot Point S2 | 16.9726 |
| Daily Pivot Point S3 | 16.8573 |
| Daily Pivot Point R1 | 17.2681 |
| Daily Pivot Point R2 | 17.3834 |
| Daily Pivot Point R3 | 17.4735 |
[/s2If]
Download Nehcap EAWe have two EAs that are operational on our LIVE accounts.
- EA-FIX: Check out the details here. Download EA-FIX . EA-FIX is a non-grid HFT scalper.
- EA-GROWTH: High quality low dd EA using trend grids. Download EA_GROWTHJoin Our Telegram Group
")


