The US dollar against the Mexican peso is currently valued at 17.1127, which represents a 0.23% decrease from the previous rate of 17.1119. This decline is attributed to underwhelming US Retail Sales figures, although there was positive news from better-than-expected jobless claims and Producer Price Index (PPI) data.
…
This is a premium post.
[s2If !current_user_can(access_s2member_level4)]Please register for FREE REGISTER to read full post below containing analysis. In case of any error or you think you are not able to read the full post below, please email us at support#nehcap.com [lwa][/s2If] [s2If current_user_can(access_s2member_level1)]
- USD/MXN trades at 17.1127, down 0.23%, as US Retail Sales disappoint, but jobless claims and PPI exceed expectations.
The pair currently trades last at 17.1119.
The previous day high was 17.2934 while the previous day low was 17.088. The daily 38.2% Fib levels comes at 17.1664, expected to provide resistance. Similarly, the daily 61.8% fib level is at 17.2149, expected to provide resistance.
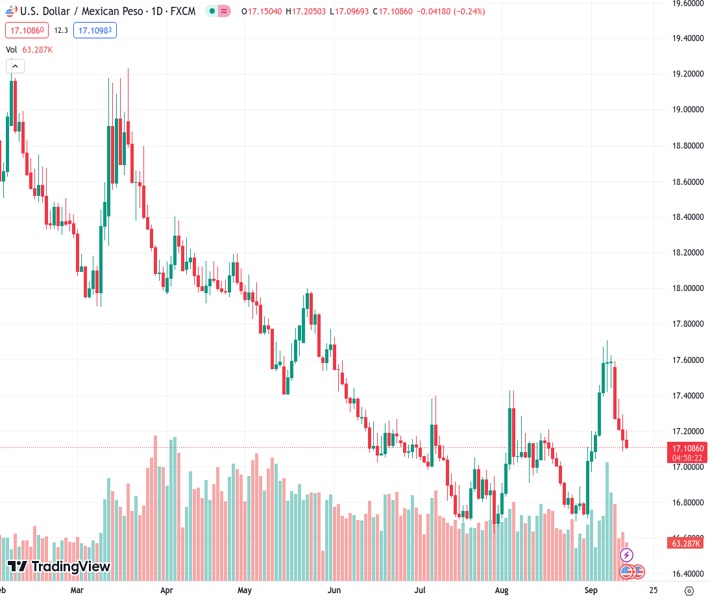
The Mexican Peso (MXN) strengthened for the fourth straight day against the Greenback (USD) earlier in the North American session after solid US economic data spurred investors’ risk appetite. The USD/MXN is trading at 17.1127, retreating some 0.23% after hitting a daily high of 17.2050.
The US Department of Commerce revealed that US Retail Sales in August were below estimates of 2.9% YoY, rose by 2.5%, but on a monthly reading, exceeded forecasts. The jump in oil prices bolstered sales, as inflation ticked higher as expected on Wednesday, as the US Department of Labor revealed August’s CPI.
Meanwhile, prices paid by producers advanced 1.6% YoY in August, above 1.2% forecasts, doubling July’s 0.8% increase. The Producer Price Index (PPI) revealed by the US Bureau of Labor Statistics (BLS), rose the most in over a year. At the same time, jobs data revealed that Initial Jobless Claims for the week ending September 9 rose to 220K, below the consensus of 225K, underscoring a hot labor market.
US Treasury bond yields seesawed after the data, with the most sensitive to interest rates, the 2-year note, yielding 5.035% at the data release, ahead of retreating below the 5.0% threshold. This bolstered the Greenback, as shown by the US Dollar Index (DXY). The DXY, which tracks the USD performance vs. a basket of six currencies, climbs 0.40%, at 105.17.
Across the border, the recent budget has gathered attention from economists in Mexico. The fact the 2024 proposed budget would increase the deficit from 3.3% to 4.9% of the Gross Domestic Product (GDP) generated different reactions as the country prepares to elect the current President, Andres Manuel Lopez Obrador. Mexico’s 10-year bond yield rose 17 basis points on Monday on the prospect of higher borrowing. Analysts at Goldman Sachs noted, “From this expansionary baseline, fiscal slippages (which would lead to a budget deficit of around 6% of GDP) could trigger sovereign rating downgrades, in particular, if growth decelerates visibly.”
Despite trading near the week’s lows, the USD/MXN appears to have bottomed at around 17.10, unable to extend its fall, capped by the presence of the 20-day Moving Average (DMA) at 17.0919. IF that level is breached, that will put the 50-DMA in play at the 17.0000 psychological level. Conversely, if the pair manages to stage a recovery, USD buyers must reclaim the 100-DMA at 17.2361, so they could threaten to recover the 17.5000 mark.
Technical Levels: Supports and Resistances
USDMXN currently trading at 17.1108 at the time of writing. Pair opened at 17.1528 and is trading with a change of -0.24 % .
| Overview | Overview.1 | |
|---|---|---|
| 0 | Today last price | 17.1108 |
| 1 | Today Daily Change | -0.0420 |
| 2 | Today Daily Change % | -0.2400 |
| 3 | Today daily open | 17.1528 |
The pair is trading above its 20 Daily moving average @ 17.0973, above its 50 Daily moving average @ 17.0189 , below its 100 Daily moving average @ 17.2518 and below its 200 Daily moving average @ 17.9822
| Trends | Trends.1 | |
|---|---|---|
| 0 | Daily SMA20 | 17.0973 |
| 1 | Daily SMA50 | 17.0189 |
| 2 | Daily SMA100 | 17.2518 |
| 3 | Daily SMA200 | 17.9822 |
The previous day high was 17.2934 while the previous day low was 17.088. The daily 38.2% Fib levels comes at 17.1664, expected to provide resistance. Similarly, the daily 61.8% fib level is at 17.2149, expected to provide resistance.
Note the levels of interest below:
- Pivot support is noted at 17.0627, 16.9726, 16.8573
- Pivot resistance is noted at 17.2681, 17.3834, 17.4735
| Levels | Levels.1 |
|---|---|
| Previous Daily High | 17.2934 |
| Previous Daily Low | 17.0880 |
| Previous Weekly High | 17.7094 |
| Previous Weekly Low | 17.0447 |
| Previous Monthly High | 17.4274 |
| Previous Monthly Low | 16.6945 |
| Daily Fibonacci 38.2% | 17.1664 |
| Daily Fibonacci 61.8% | 17.2149 |
| Daily Pivot Point S1 | 17.0627 |
| Daily Pivot Point S2 | 16.9726 |
| Daily Pivot Point S3 | 16.8573 |
| Daily Pivot Point R1 | 17.2681 |
| Daily Pivot Point R2 | 17.3834 |
| Daily Pivot Point R3 | 17.4735 |
[/s2If]
Download Nehcap EAWe have two EAs that are operational on our LIVE accounts.
- EA-FIX: Check out the details here. Download EA-FIX . EA-FIX is a non-grid HFT scalper.
- EA-GROWTH: High quality low dd EA using trend grids. Download EA_GROWTHJoin Our Telegram Group
")


