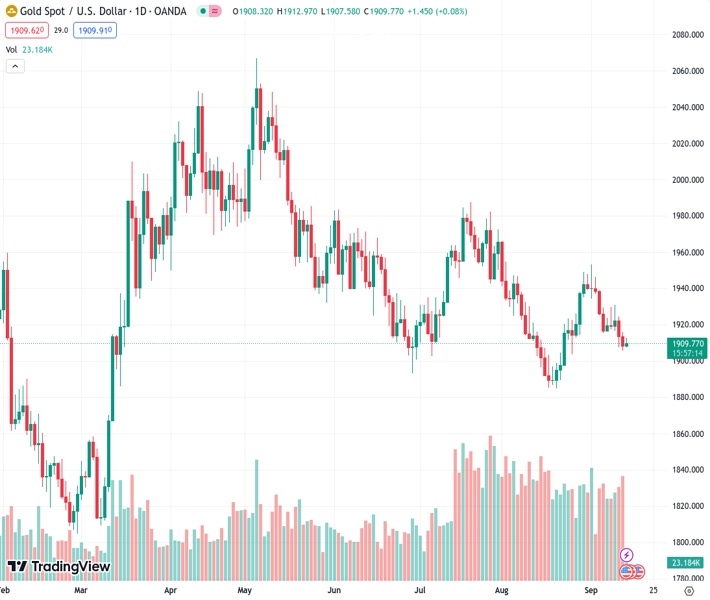
The price of gold at $1,909.55 remains stable and breaks a series of losses, staying above the $1,900 mark.
…
This is a premium post.
[s2If !current_user_can(access_s2member_level4)]Please register for FREE REGISTER to read full post below containing analysis. In case of any error or you think you are not able to read the full post below, please email us at support#nehcap.com [lwa][/s2If] [s2If current_user_can(access_s2member_level1)]
- Gold price holds ground above $1,900, snapping a losing streak.
The pair currently trades last at 1909.55.
The previous day high was 1915.79 while the previous day low was 1905.59. The daily 38.2% Fib levels comes at 1909.49, expected to provide support. Similarly, the daily 61.8% fib level is at 1911.89, expected to provide resistance.
Gold price attempts to snap a two-day losing streak, edging higher around $1,910 per troy ounce during the Asian session on Thursday after Consumer Price Index (CPI) data from the United States (US).
US Consumer Price Index (CPI) (YoY) exceeded expectations, rising to 3.7% from the previous rate of 3.2%, surpassing the market’s anticipated 3.6% for August. Furthermore, the monthly core CPI showed improvement, increasing to 0.3% from the prior 0.2% for the same month. This increase was unexpected, as market expectations had been for it to remain unchanged.
However, the annual core inflation rate aligned with expectations, holding steady at 4.3%, consistent with the previous figure of 4.7%.
The data suggests that while overall inflation may be moderating, the Core Consumer Price Index (CPI) remains relatively stable. This information initially led to a rise in US Treasury yields, but those gains were later retraced. The market sentiment seemed to improve with the belief that the US Federal Reserve (Fed) will maintain a dovish stance in its September meeting.
This dovish sentiment has provided support for the prices of Gold, as investors seek alternative stores of value. This has contributed to the weakening of the US Dollar (USD).
CME FedWatch Tool indicates that the Fed is likely to maintain interest rates within the range of 5.25% to 5.50% for the September meeting. This suggests that market participants are increasingly anticipating a more dovish stance from the Fed in the near term.
Despite the diminished probability of an interest rate hike in September, there is a 40% likelihood of a 25 basis points (bps) rate increase by the Federal Reserve (Fed) in November. This suggests that market sentiment is increasingly inclined towards the Fed pursuing a monetary tightening policy later in the year, potentially in November. Investors turn cautious about the possibility of such a move as they assess the evolving economic landscape and Fed statements.
While an immediate rate hike in September may not be on the horizon, investors are anticipating the possibility of such a move in the near future, likely in November or beyond. This reflects the ongoing uncertainty and evolving expectations regarding Fed policy decisions.
US Dollar Index (DXY), which measures the performance of the US Dollar (USD) against a basket of the other major six currencies, is reversing some of the gains it made in the previous trading session. The spot price is trading lower around 104.60 at the time of writing. This suggests that the US Dollar may be facing some selling pressure or a correction after its recent strength.
Market participants are currently directing their attention to forthcoming data releases from the United States (US), including the Core Producer Price Index (PPI) and Retail Sales figures for August.
These economic indicators will provide valuable insights into the state of economic activity in the US and are likely to influence trading decisions and market sentiment, particularly concerning the Greenback.
Technical Levels: Supports and Resistances
XAUUSD currently trading at 1910.1 at the time of writing. Pair opened at 1908.12 and is trading with a change of 0.1 % .
| Overview | Overview.1 | |
|---|---|---|
| 0 | Today last price | 1910.10 |
| 1 | Today Daily Change | 1.98 |
| 2 | Today Daily Change % | 0.10 |
| 3 | Today daily open | 1908.12 |
The pair remains strongly bearish on the daily time frame. It trades below the 20 SMA @ 1918.15, 50 SMA 1931.85, 100 SMA @ 1948.34 and 200 SMA @ 1920.92.
| Trends | Trends.1 | |
|---|---|---|
| 0 | Daily SMA20 | 1918.15 |
| 1 | Daily SMA50 | 1931.85 |
| 2 | Daily SMA100 | 1948.34 |
| 3 | Daily SMA200 | 1920.92 |
The previous day high was 1915.79 while the previous day low was 1905.59. The daily 38.2% Fib levels comes at 1909.49, expected to provide support. Similarly, the daily 61.8% fib level is at 1911.89, expected to provide resistance.
Note the levels of interest below:
- Pivot support is noted at 1903.88, 1899.63, 1893.68
- Pivot resistance is noted at 1914.08, 1920.03, 1924.28
| Levels | Levels.1 |
|---|---|
| Previous Daily High | 1915.79 |
| Previous Daily Low | 1905.59 |
| Previous Weekly High | 1946.35 |
| Previous Weekly Low | 1915.33 |
| Previous Monthly High | 1966.08 |
| Previous Monthly Low | 1884.85 |
| Daily Fibonacci 38.2% | 1909.49 |
| Daily Fibonacci 61.8% | 1911.89 |
| Daily Pivot Point S1 | 1903.88 |
| Daily Pivot Point S2 | 1899.63 |
| Daily Pivot Point S3 | 1893.68 |
| Daily Pivot Point R1 | 1914.08 |
| Daily Pivot Point R2 | 1920.03 |
| Daily Pivot Point R3 | 1924.28 |
[/s2If]
Download Nehcap EAWe have two EAs that are operational on our LIVE accounts.
- EA-FIX: Check out the details here. Download EA-FIX . EA-FIX is a non-grid HFT scalper.
- EA-GROWTH: High quality low dd EA using trend grids. Download EA_GROWTHJoin Our Telegram Group
")


