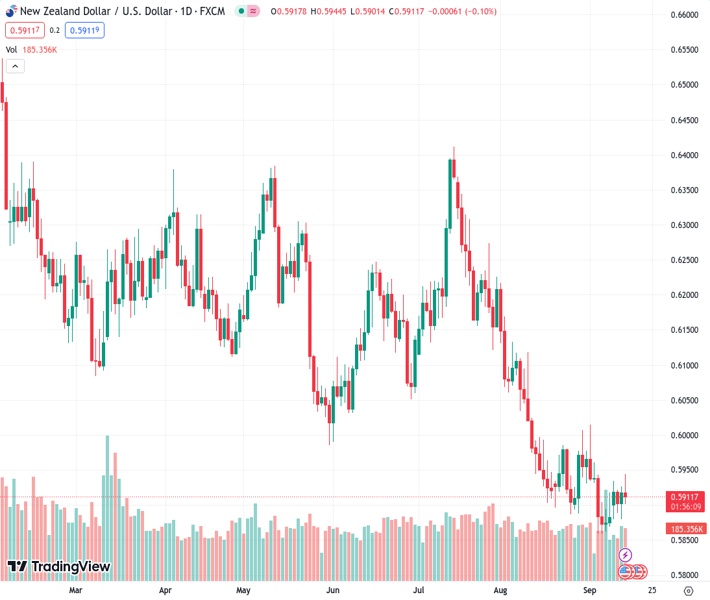
The New Zealand dollar against the US dollar is at 0.59101. In August, retail sales in the US increased by 2.6% compared to the same period last year. While this figure fell short of expectations, it suggests that consumer spending remains strong.
…
This is a premium post.
[s2If !current_user_can(access_s2member_level4)]Please register for FREE REGISTER to read full post below containing analysis. In case of any error or you think you are not able to read the full post below, please email us at support#nehcap.com [lwa][/s2If] [s2If current_user_can(access_s2member_level1)]
- US August retail sales rose by 2.6% YoY, missing estimates but signaling consumer spending resilience.
The pair currently trades last at 0.59101.
The previous day high was 0.5928 while the previous day low was 0.588. The daily 38.2% Fib levels comes at 0.591, expected to provide support. Similarly, the daily 61.8% fib level is at 0.5898, expected to provide support.
The Greenback (USD)t) stages a recovery against the New Zealand Dollar (NZD) on Thursday, as the NZD/USD pair drops 0.13% following the release of data from the United States (US). The pair is trading at 0.5910 after hitting a daily high of 0.5944.
The latest data revealed during the day showed the US economy remains resilient, as consumer spending keeps investors hopeful the Federal Reserve would achieve a soft landing despite keeping interest rates higher for longer.
The US Department of Commerce revealed that August retail Sales rose by 2.6% YoY, below July’s downward revised 2.6% figures, and missed estimates of 2.9%. Digging deeper into the data, core Retail Sales, which exclude volatile items, grew by 0.2% beneath forecasts of 0.6%.
At the same time, the US Bureau of Labor Statistics (BLS) revealed the Producer Price Index (PPI) for the same period as above-mentioned. The PPII climbed 1.6% YoY in August and exceeded estimates of 1.2%, doubling July’s 0.8% increase. Other data announced by the BLS showed that Initial Jobless Claims for the week ending September 9 rose to 220K, below the consensus of 225K, underscoring a hot labor market.
Per the NZD/USD’s reaction to the data, market participants believe there will be another rate hike by the Fed before the year’s end. The CME FedWatch Tool shows the Fed would not raise rates at the September meeting. But for November, there’s a 35% chance the US central bank could lift rates.
On the New Zealand (NZ) front, traders are bracing for the release of Manufacturing PMI data. Although most PMIs released worldwide suggest an ongoing economic slowdown, NZ is not immune. New Zealand’s PMI shrank for five consecutive months, with the trend expected to extend to August, with estimates of 46.0.
Besides that, NZ’s major trading partner, China, is expected to release retail sales and industrial production. If the data returns positive and exceeds prior readings, that could lend a lifeline to the NZD/USD pair.
After today’s data, the pair printed a new two-week high, which NZD/USD sellers used to open fresh shorts positions as the major shifted bearish and dropped toward the 0.5910 area as price action began to form an inverted hammer. A decisive break below 0.5900 could open the door to test the year-to-date (YTD) low of 0.5859. On the other hand, the major would shift neutral if NZD bulls reclaim 0.6000.
Technical Levels: Supports and Resistances
NZDUSD currently trading at 0.5911 at the time of writing. Pair opened at 0.5918 and is trading with a change of -0.12 % .
| Overview | Overview.1 | |
|---|---|---|
| 0 | Today last price | 0.5911 |
| 1 | Today Daily Change | -0.0007 |
| 2 | Today Daily Change % | -0.1200 |
| 3 | Today daily open | 0.5918 |
The pair remains strongly bearish on the daily time frame. It trades below the 20 SMA @ 0.5924, 50 SMA 0.6065, 100 SMA @ 0.6117 and 200 SMA @ 0.6204.
| Trends | Trends.1 | |
|---|---|---|
| 0 | Daily SMA20 | 0.5924 |
| 1 | Daily SMA50 | 0.6065 |
| 2 | Daily SMA100 | 0.6117 |
| 3 | Daily SMA200 | 0.6204 |
The previous day high was 0.5928 while the previous day low was 0.588. The daily 38.2% Fib levels comes at 0.591, expected to provide support. Similarly, the daily 61.8% fib level is at 0.5898, expected to provide support.
Note the levels of interest below:
- Pivot support is noted at 0.589, 0.5861, 0.5842
- Pivot resistance is noted at 0.5938, 0.5957, 0.5986
| Levels | Levels.1 |
|---|---|
| Previous Daily High | 0.5928 |
| Previous Daily Low | 0.5880 |
| Previous Weekly High | 0.5961 |
| Previous Weekly Low | 0.5847 |
| Previous Monthly High | 0.6219 |
| Previous Monthly Low | 0.5885 |
| Daily Fibonacci 38.2% | 0.5910 |
| Daily Fibonacci 61.8% | 0.5898 |
| Daily Pivot Point S1 | 0.5890 |
| Daily Pivot Point S2 | 0.5861 |
| Daily Pivot Point S3 | 0.5842 |
| Daily Pivot Point R1 | 0.5938 |
| Daily Pivot Point R2 | 0.5957 |
| Daily Pivot Point R3 | 0.5986 |
[/s2If]
Download Nehcap EAWe have two EAs that are operational on our LIVE accounts.
- EA-FIX: Check out the details here. Download EA-FIX . EA-FIX is a non-grid HFT scalper.
- EA-GROWTH: High quality low dd EA using trend grids. Download EA_GROWTHJoin Our Telegram Group
")


