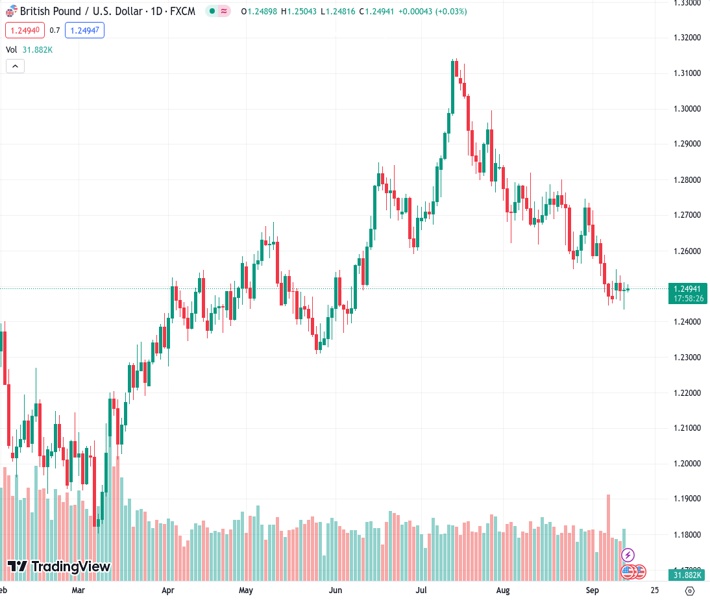
The GBPUSD pair is trading within a close range of 1.2485-1.2505, with minimal fluctuations.
…
This is a premium post.
[s2If !current_user_can(access_s2member_level4)]Please register for FREE REGISTER to read full post below containing analysis. In case of any error or you think you are not able to read the full post below, please email us at support#nehcap.com [lwa][/s2If] [s2If current_user_can(access_s2member_level1)]
- GBP/USD oscillates around the 1.2485- 1.2505 region in a narrow trading band.
The pair currently trades last at 1.24925.
The previous day high was 1.2512 while the previous day low was 1.2435. The daily 38.2% Fib levels comes at 1.2464, expected to provide support. Similarly, the daily 61.8% fib level is at 1.2482, expected to provide support.
The GBP/USD pair consolidates in a narrow range around 1.2490 during the early Asian session on Wednesday. The major pair remains capped by the 1.2500 barrier ahead of the US economic data released.
Tuesday’s data indicated a bigger rise in the unemployment rate than anticipated, but the BoE remains concerned that wage growth will sustain persistent inflation. The UK’s Office for National Statistics revealed that the UK Unemployment Rate in the three months to July came in at 4.3% from 4.2% in the previous reading, Meanwhile, Employment Change for July declined by 207K from a 66K drop in the previous reading, worse than the estimated 185K drop. The Average Earnings Including Bonus in the three months to July rose by 8.5% versus 8.2% prior. Excluding bonus, the figure remains at 7.8%, as expected.
Additionally, the UK Gross Domestic Product (GDP) declined 0.5% MoM in July, following a 0.5% expansion in June and a worse-than-expectation 0.2% drop. The speed of the slowdown fuels the concern about the potential recession in the UK economy.
Catherine Mann, a Bank of England (BoE) policymaker, stated on Monday that it was too early for the central bank to pause interest rates and that it was preferable for the central bank to err on the side of raising them too high rather than halting too soon. However, The British Pound (GBP) attracts some sellers as investors are concerned about the aggressive tightening cycle that will impact the UK economy.
Across the pond, the US Bureau of Labor Statistics showed on Wednesday that the headline inflation in August hit the highest monthly gain in 14 months with the US Consumer Price Index (CPI) rising 0.6% MoM from 0.2% in the previous reading. The annual figure came in at 3.7% from 3.2%, better than expected. The core CPI, which excludes volatile food and energy prices climbed 0.3% MoM from 0.2% in the previous month. The annual core CPI came in at 4.3% versus 4.7% prior.
Markets believe that the Federal Reserve (Fed) will hold interest rates unchanged at next week’s FOMC meeting. However, the figures imply that the Fed should be on the lookout for any re-acceleration in inflation in the next months. According to the CME Fedwatch Tool, investors have priced in 97% odds of interest rate unchanged in September at 5.25%-5.50%. However, the possibility of a rate hike in the November meeting increased to 49.2%.
In the absence of economic data released from the UK docket on Wednesday, the GBP/USD pair remains at the mercy of USD price dynamics. Market participants will keep an eye on the release of the US weekly Initial Jobless Claims, the Producer Price Index (PPI) and monthly Retail Sales due later in the day. On Friday, the preliminary Michigan Consumer Sentiment Index for September will be due. These figures could give a clear direction to GBP/USD and traders will find the trading opportunities around the major pair.
Technical Levels: Supports and Resistances
GBPUSD currently trading at 1.2491 at the time of writing. Pair opened at 1.249 and is trading with a change of 0.01 % .
| Overview | Overview.1 | |
|---|---|---|
| 0 | Today last price | 1.2491 |
| 1 | Today Daily Change | 0.0001 |
| 2 | Today Daily Change % | 0.0100 |
| 3 | Today daily open | 1.2490 |
The pair is trading below its 20 Daily moving average @ 1.2612, below its 50 Daily moving average @ 1.2749 , below its 100 Daily moving average @ 1.2656 and above its 200 Daily moving average @ 1.2431
| Trends | Trends.1 | |
|---|---|---|
| 0 | Daily SMA20 | 1.2612 |
| 1 | Daily SMA50 | 1.2749 |
| 2 | Daily SMA100 | 1.2656 |
| 3 | Daily SMA200 | 1.2431 |
The previous day high was 1.2512 while the previous day low was 1.2435. The daily 38.2% Fib levels comes at 1.2464, expected to provide support. Similarly, the daily 61.8% fib level is at 1.2482, expected to provide support.
Note the levels of interest below:
- Pivot support is noted at 1.2446, 1.2402, 1.2369
- Pivot resistance is noted at 1.2523, 1.2556, 1.26
| Levels | Levels.1 |
|---|---|
| Previous Daily High | 1.2512 |
| Previous Daily Low | 1.2435 |
| Previous Weekly High | 1.2643 |
| Previous Weekly Low | 1.2446 |
| Previous Monthly High | 1.2841 |
| Previous Monthly Low | 1.2548 |
| Daily Fibonacci 38.2% | 1.2464 |
| Daily Fibonacci 61.8% | 1.2482 |
| Daily Pivot Point S1 | 1.2446 |
| Daily Pivot Point S2 | 1.2402 |
| Daily Pivot Point S3 | 1.2369 |
| Daily Pivot Point R1 | 1.2523 |
| Daily Pivot Point R2 | 1.2556 |
| Daily Pivot Point R3 | 1.2600 |
[/s2If]
Download Nehcap EAWe have two EAs that are operational on our LIVE accounts.
- EA-FIX: Check out the details here. Download EA-FIX . EA-FIX is a non-grid HFT scalper.
- EA-GROWTH: High quality low dd EA using trend grids. Download EA_GROWTHJoin Our Telegram Group
")


