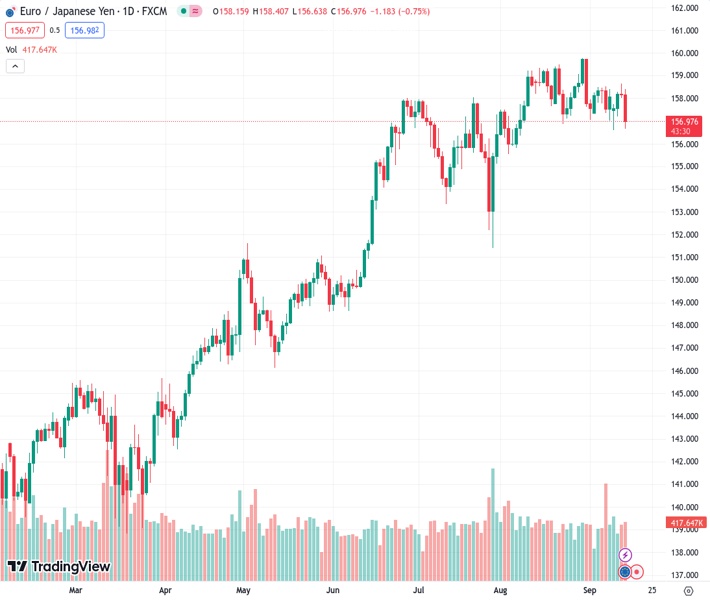
The EURJPY currency pair, currently valued at 156.925, experiences a decline of 0.78%. This leads it to reach a low point of 156.64 over the course of three days. The decrease follows the European Central Bank’s decision to raise interest rates by 25 basis points, but also provide a cautious outlook.
…
This is a premium post.
[s2If !current_user_can(access_s2member_level4)]Please register for FREE REGISTER to read full post below containing analysis. In case of any error or you think you are not able to read the full post below, please email us at support#nehcap.com [lwa][/s2If] [s2If current_user_can(access_s2member_level1)]
- EUR/JPY falls 0.78% to a three-day low of 156.64 after ECB raises rates by 25 bps but signals caution.
The pair currently trades last at 156.925.
The previous day high was 158.66 while the previous day low was 158.01. The daily 38.2% Fib levels comes at 158.41, expected to provide resistance. Similarly, the daily 61.8% fib level is at 158.26, expected to provide resistance.
Late in the North American session, the EUR/JPY pair plunged sharply following a dovish rate hike by the European Central Bank (ECB), which raised rates by 25 bps for the tenth time since the central bank began its tightening cycle. Hence, the cross-currency pair extends its losses of 0.78%, falling to a new three-day low of 156.64 but shy of a new weekly low. The pair exchanges hands at 156.91.
After achieving another lower low, the currency pair is neutrally biased yet remains above the Ichimoku Cloud (Kumo), seen as a bullish signal. Nonetheless, the Chikou Span crossing below the price action and the cross-over of the Tenkan-Sen below the Kijun-Sen gives two bearish signals that, summed to the market structure, portray the pair as slightly tilted to the downside.
In the short term, the EUR/JPY hourly chart depicts the pair diving to a three-day low, with bulls and bears fighting just below the 157.00 figure. If the pair achieves a daily close below that level, expect a re-test of the weekly low of 156.58 before the cross extends its losses toward the 156.00 figure. On the flip side, if the currency pair ends the day above 157.00, an upward correction is seen toward 157.52/64, a zone of confluence, where the Kijun-Sen, Tenkan-Sen, and the Senkou Span A and B lie before resuming its uptrend.
Technical Levels: Supports and Resistances
EURJPY currently trading at 156.92 at the time of writing. Pair opened at 158.22 and is trading with a change of -0.82 % .
| Overview | Overview.1 | |
|---|---|---|
| 0 | Today last price | 156.92 |
| 1 | Today Daily Change | -1.30 |
| 2 | Today Daily Change % | -0.82 |
| 3 | Today daily open | 158.22 |
The pair is trading below its 20 Daily moving average @ 158.21, below its 50 Daily moving average @ 157.18 , above its 100 Daily moving average @ 154.33 and above its 200 Daily moving average @ 148.61
| Trends | Trends.1 | |
|---|---|---|
| 0 | Daily SMA20 | 158.21 |
| 1 | Daily SMA50 | 157.18 |
| 2 | Daily SMA100 | 154.33 |
| 3 | Daily SMA200 | 148.61 |
The previous day high was 158.66 while the previous day low was 158.01. The daily 38.2% Fib levels comes at 158.41, expected to provide resistance. Similarly, the daily 61.8% fib level is at 158.26, expected to provide resistance.
Note the levels of interest below:
- Pivot support is noted at 157.94, 157.65, 157.29
- Pivot resistance is noted at 158.58, 158.94, 159.23
| Levels | Levels.1 |
|---|---|
| Previous Daily High | 158.66 |
| Previous Daily Low | 158.01 |
| Previous Weekly High | 158.52 |
| Previous Weekly Low | 157.00 |
| Previous Monthly High | 159.76 |
| Previous Monthly Low | 155.53 |
| Daily Fibonacci 38.2% | 158.41 |
| Daily Fibonacci 61.8% | 158.26 |
| Daily Pivot Point S1 | 157.94 |
| Daily Pivot Point S2 | 157.65 |
| Daily Pivot Point S3 | 157.29 |
| Daily Pivot Point R1 | 158.58 |
| Daily Pivot Point R2 | 158.94 |
| Daily Pivot Point R3 | 159.23 |
[/s2If]
Download Nehcap EAWe have two EAs that are operational on our LIVE accounts.
- EA-FIX: Check out the details here. Download EA-FIX . EA-FIX is a non-grid HFT scalper.
- EA-GROWTH: High quality low dd EA using trend grids. Download EA_GROWTHJoin Our Telegram Group
")


