Silver prices experience slight upward movement on Thursday but do not show strong bullish sentiment.
…
This is a premium post.
[s2If !current_user_can(access_s2member_level4)]Please register for FREE REGISTER to read full post below containing analysis. In case of any error or you think you are not able to read the full post below, please email us at support#nehcap.com [lwa][/s2If] [s2If current_user_can(access_s2member_level1)]
- Silver gains some positive traction on Thursday, albeit lacks bullish conviction.
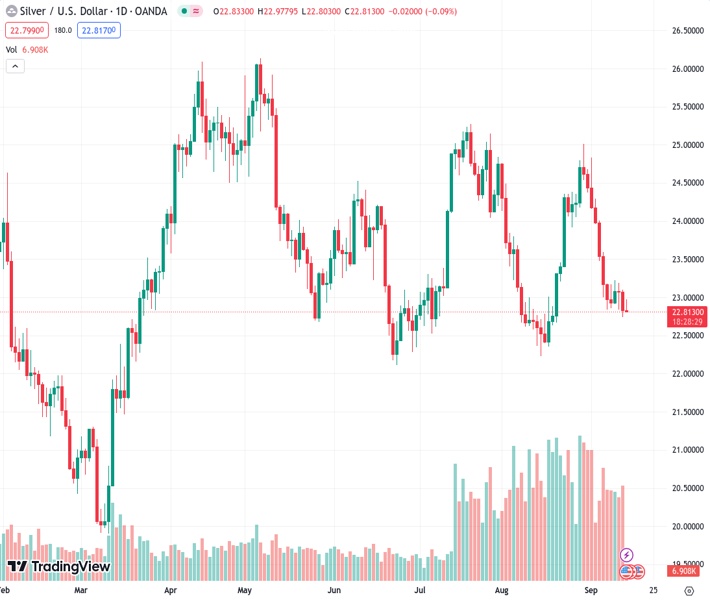
The pair currently trades last at 22.812.
The previous day high was 23.1 while the previous day low was 22.74. The daily 38.2% Fib levels comes at 22.88, expected to provide resistance. Similarly, the daily 61.8% fib level is at 22.96, expected to provide resistance.
Silver attracts some buyers during the Asian session on Thursday and reverses a part of the previous day’s slide to over a three-week-low, though lacks follow-through and remains below the $23.00 mark.
From a technical perspective, the overnight decline below the $22.85-$22.80 horizontal support could be seen as a fresh trigger for bearish traders. Moreover, oscillators on the daily chart are holding in the negative territory and are still far from being in the oversold zone. This, in turn, suggests that the path of least resistance for the XAG/USD is to the downside.
Hence, a subsequent slide back towards testing a strong horizontal support, near the $22.20-$22.10 zone, looks like a distinct possibility. This is followed by the $22.00 round-figure mark, which if broken decisively will pave the way for an extension of a multi-week-old descending trend and drag the XAG/USD to the next relevant support near the $21.25 region.
On the flip side, movement beyond the $23.00 mark now seems to confront stiff resistance near the $23.20 supply zone. Any further move up might be seen as a selling opportunity and remain capped near the 200-day Simple Moving Average (SMA), currently near the $23.45-$23.50 area. This is followed by the 100-day SMA barrier, around the $23.80 region, and the $24.00 mark.
A sustained strength beyond the aforementioned hurdles should negate the near-term negative outlook for the XAG/USD. The subsequent short-covering move has the potential to lift the white metal beyond the $24.30-$24.35 resistance, towards reclaiming the $25.00 psychological mark. The latter represents the August monthly swing high and should act as a pivotal point.
Technical Levels: Supports and Resistances
XAGUSD currently trading at 22.84 at the time of writing. Pair opened at 22.84 and is trading with a change of 0.0 % .
| Overview | Overview.1 | |
|---|---|---|
| 0 | Today last price | 22.84 |
| 1 | Today Daily Change | 0.00 |
| 2 | Today Daily Change % | 0.00 |
| 3 | Today daily open | 22.84 |
The pair remains strongly bearish on the daily time frame. It trades below the 20 SMA @ 23.63, 50 SMA 23.74, 100 SMA @ 23.78 and 200 SMA @ 23.48.
| Trends | Trends.1 | |
|---|---|---|
| 0 | Daily SMA20 | 23.63 |
| 1 | Daily SMA50 | 23.74 |
| 2 | Daily SMA100 | 23.78 |
| 3 | Daily SMA200 | 23.48 |
The previous day high was 23.1 while the previous day low was 22.74. The daily 38.2% Fib levels comes at 22.88, expected to provide resistance. Similarly, the daily 61.8% fib level is at 22.96, expected to provide resistance.
Note the levels of interest below:
- Pivot support is noted at 22.69, 22.54, 22.34
- Pivot resistance is noted at 23.04, 23.24, 23.39
| Levels | Levels.1 |
|---|---|
| Previous Daily High | 23.10 |
| Previous Daily Low | 22.74 |
| Previous Weekly High | 24.30 |
| Previous Weekly Low | 22.83 |
| Previous Monthly High | 25.02 |
| Previous Monthly Low | 22.23 |
| Daily Fibonacci 38.2% | 22.88 |
| Daily Fibonacci 61.8% | 22.96 |
| Daily Pivot Point S1 | 22.69 |
| Daily Pivot Point S2 | 22.54 |
| Daily Pivot Point S3 | 22.34 |
| Daily Pivot Point R1 | 23.04 |
| Daily Pivot Point R2 | 23.24 |
| Daily Pivot Point R3 | 23.39 |
[/s2If]
Download Nehcap EAWe have two EAs that are operational on our LIVE accounts.
- EA-FIX: Check out the details here. Download EA-FIX . EA-FIX is a non-grid HFT scalper.
- EA-GROWTH: High quality low dd EA using trend grids. Download EA_GROWTHJoin Our Telegram Group
")


