On Thursday, the USDJPY currency pair encounters a new level of selling pressure at a rate of 147.076 due to a variety of factors.
…
This is a premium post.
[s2If !current_user_can(access_s2member_level4)]Please register for FREE REGISTER to read full post below containing analysis. In case of any error or you think you are not able to read the full post below, please email us at support#nehcap.com [lwa][/s2If] [s2If current_user_can(access_s2member_level1)]
- USD/JPY meets with a fresh supply on Thursday and is pressured by a combination of factors.
The pair currently trades last at 147.076.
The previous day high was 147.74 while the previous day low was 147.02. The daily 38.2% Fib levels comes at 147.47, expected to provide resistance. Similarly, the daily 61.8% fib level is at 147.29, expected to provide resistance.
The USD/JPY pair comes under some selling pressure during the Asian session on Thursday and snaps a two-day winning streak to the weekly high, around the 147.75 region touched the previous day. Spot prices drop to the 147.00 mark, or a fresh daily low in the last hour, with bears now awaiting a sustained break and acceptance below the 200-hour Simple Moving Average (SMA) before positioning for any further losses.
The Japanese Yen (JPY) is underpinned by speculations that the Bank of Japan (BoJ) will end its ultra-easy monetary policy, which, in turn, is seen as a key factor weighing on the USD/JPY pair. In fact, the markets are now betting that the central bank may scrap its yield-curve control (YCC) policy and put an end to negative interest rates as early as this year, especially after the BoJ Governor Kazuo Ueda’s hawkish comments over the weekend.
In an interview with Yomiuri newspaper, Ueda signalled that hiking interest rate is among the options available if the BoJ becomes confident that prices and wages will keep going up sustainably. This, in turn, triggered a sell-off in the Japanese government bonds (JGB) and pushed the yield on the benchmark 10-year JGB to its highest level since January 2014 on Tuesday, which continues to act as a tailwind for the JPY.
Apart from this, the emergence of some US Dollar (USD) selling, amid the uncertainty over the Federal Reserve’s (Fed) future rate-hike path, contributes to the offered tone surrounding the USD/JPY pair. The US consumer inflation figures released on Wednesday ensured that the Fed will keep rates steady at its policy meeting next week. The still-sticky inflation, however, keeps hopes for one more lift-off by the end of this year.
The current market pricing indicates a more than 50% chance of a 25 basis points (bps) lift-off either in November or December. This, in turn, might hold back the USD bears from placing aggressive bearish and help limit losses for the USD/JPY pair. Traders now look to the US economic docket – featuring the release of the usual Weekly Initial Jobless Claims, the Producer Price Index (PPI) and monthly Retail Sales – for a fresh impetus.
Technical Levels: Supports and Resistances
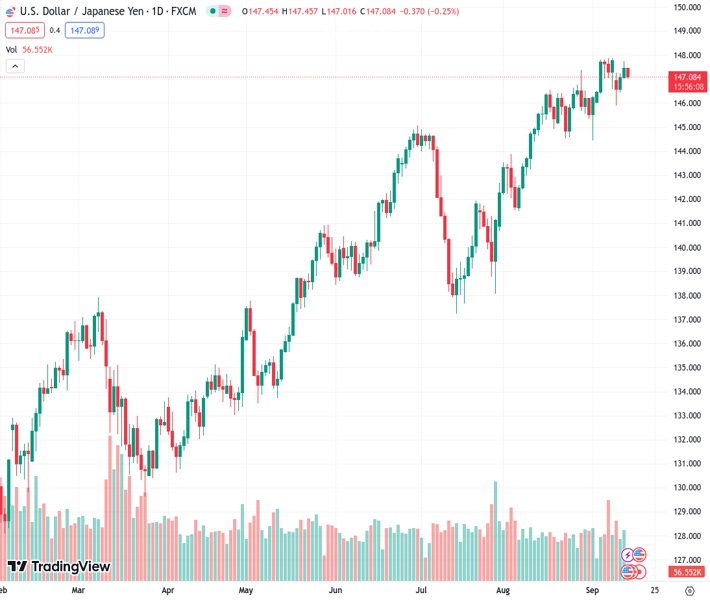
USDJPY currently trading at 147.09 at the time of writing. Pair opened at 147.46 and is trading with a change of -0.25 % .
| Overview | Overview.1 | |
|---|---|---|
| 0 | Today last price | 147.09 |
| 1 | Today Daily Change | -0.37 |
| 2 | Today Daily Change % | -0.25 |
| 3 | Today daily open | 147.46 |
The pair remains strongly bullish on the daily timeframe. It trades above its 20 SMA @ 146.45, 50 SMA 143.69, 100 SMA @ 141.57 and 200 SMA @ 137.24.
| Trends | Trends.1 | |
|---|---|---|
| 0 | Daily SMA20 | 146.45 |
| 1 | Daily SMA50 | 143.69 |
| 2 | Daily SMA100 | 141.57 |
| 3 | Daily SMA200 | 137.24 |
The previous day high was 147.74 while the previous day low was 147.02. The daily 38.2% Fib levels comes at 147.47, expected to provide resistance. Similarly, the daily 61.8% fib level is at 147.29, expected to provide resistance.
Note the levels of interest below:
- Pivot support is noted at 147.07, 146.68, 146.34
- Pivot resistance is noted at 147.8, 148.13, 148.52
| Levels | Levels.1 |
|---|---|
| Previous Daily High | 147.74 |
| Previous Daily Low | 147.02 |
| Previous Weekly High | 147.88 |
| Previous Weekly Low | 146.02 |
| Previous Monthly High | 147.38 |
| Previous Monthly Low | 141.51 |
| Daily Fibonacci 38.2% | 147.47 |
| Daily Fibonacci 61.8% | 147.29 |
| Daily Pivot Point S1 | 147.07 |
| Daily Pivot Point S2 | 146.68 |
| Daily Pivot Point S3 | 146.34 |
| Daily Pivot Point R1 | 147.80 |
| Daily Pivot Point R2 | 148.13 |
| Daily Pivot Point R3 | 148.52 |
[/s2If]
Download Nehcap EAWe have two EAs that are operational on our LIVE accounts.
- EA-FIX: Check out the details here. Download EA-FIX . EA-FIX is a non-grid HFT scalper.
- EA-GROWTH: High quality low dd EA using trend grids. Download EA_GROWTHJoin Our Telegram Group
")


