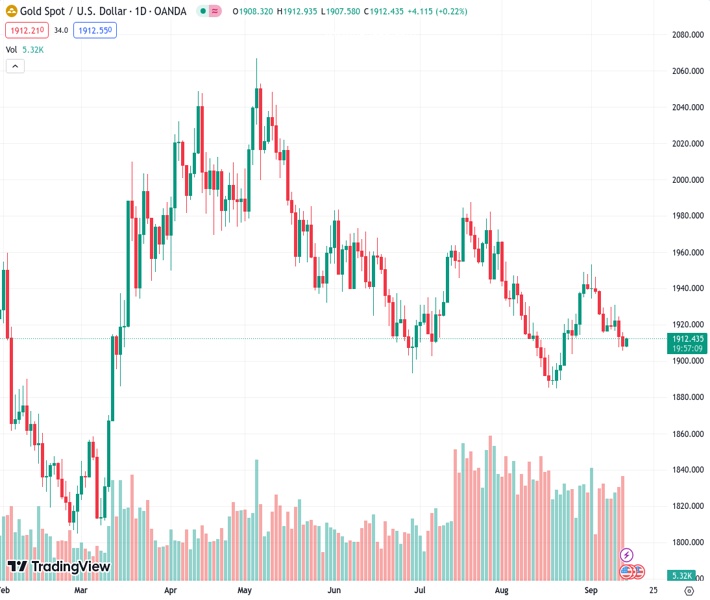
Gold price at 1,912.60 is drawing in buyers and recovering from some of the losses seen overnight, which had pushed it to its lowest level in several weeks.
…
This is a premium post.
[s2If !current_user_can(access_s2member_level4)]Please register for FREE REGISTER to read full post below containing analysis. In case of any error or you think you are not able to read the full post below, please email us at support#nehcap.com [lwa][/s2If] [s2If current_user_can(access_s2member_level1)]
- Gold price attracts some buying and reverses a part of the overnight losses to a multi-week low.
The pair currently trades last at 1912.60.
The previous day high was 1915.79 while the previous day low was 1905.59. The daily 38.2% Fib levels comes at 1909.49, expected to provide support. Similarly, the daily 61.8% fib level is at 1911.89, expected to provide support.
Gold price edges higher during the Asian session on Thursday and for now, seems to have snapped a two-day losing streak to a nearly three-week low, around the $1,906-$1,905 region touched the previous day. The XAU/USD currently trades just above the $1,910 area, though lacks bullish conviction. Moreover, the fundamental backdrop still seems tilted in favour of bearish traders and supports prospects for an extension of a two-week-old downtrend, from a one-month peak near the $1,953 zone touched on September 1.
In the absence of any big surprises from the United States (US) consumer inflation figures, market participants now seem assured that the Federal Reserve (Fed) will keep interest rates steady at its policy meeting next week. This, in turn, keeps the US Dollar (USD) bulls on the defensive and lends some support to the Gold price. The US Bureau of Labor Statistics (BLS) reported that the headline US Consumer Price Index (CPI) surged to 3.7% on a yearly basis in August from 3.2% in July. The reading was slightly above expectations for a reading of 3.6%, though the monthly print matched forecasts and came in at 0.6%.
Moreover, the core CPI, which strips out volatile items like food and fuel, also met consensus estimates and rose 4.3% during the reported month. Nevertheless, the data pointed to still-sticky inflation and keeps hopes for one more Fed rate hike move by the end of this year. In fact, the current market pricing indicates a more than 50% chance of a 25 basis points (bps) lift-off either in November or December. This, in turn, might continue to act as a tailwind for the Greenback and keep a lid on any meaningful appreciating move for the non-yielding Gold price, warranting some caution for aggressive bullish traders.
Even from a technical perspective, this week’s sustained break and acceptance below the very important 200-day Simple Moving Average (SMA) suggests that the path of least resistance for the XAU/USD is to the downside. Hence, any subsequent move up might still be seen as a selling opportunity and remain capped. Bearish traders, however, might wait for some follow-through selling below the $1,900 psychological mark before positioning for any further losses. Investors now look to the outcome of the highly-anticipated European Central Bank (ECB) meeting for some meaningful impetus around the Gold price.
Apart from this, traders will take cues from the US economic docket – featuring the release of the usual Weekly Initial Jobless Claims, the Producer Price Index (PPI) and monthly Retail Sales. The data might influence the USD price dynamics, which, along with the post-ECB volatility, should allow traders to grab short-term opportunities around the Gold price.
Technical Levels: Supports and Resistances
XAUUSD currently trading at 1911.69 at the time of writing. Pair opened at 1908.12 and is trading with a change of 0.19 % .
| Overview | Overview.1 | |
|---|---|---|
| 0 | Today last price | 1911.69 |
| 1 | Today Daily Change | 3.57 |
| 2 | Today Daily Change % | 0.19 |
| 3 | Today daily open | 1908.12 |
The pair remains strongly bearish on the daily time frame. It trades below the 20 SMA @ 1918.15, 50 SMA 1931.85, 100 SMA @ 1948.34 and 200 SMA @ 1920.92.
| Trends | Trends.1 | |
|---|---|---|
| 0 | Daily SMA20 | 1918.15 |
| 1 | Daily SMA50 | 1931.85 |
| 2 | Daily SMA100 | 1948.34 |
| 3 | Daily SMA200 | 1920.92 |
The previous day high was 1915.79 while the previous day low was 1905.59. The daily 38.2% Fib levels comes at 1909.49, expected to provide support. Similarly, the daily 61.8% fib level is at 1911.89, expected to provide support.
Note the levels of interest below:
- Pivot support is noted at 1903.88, 1899.63, 1893.68
- Pivot resistance is noted at 1914.08, 1920.03, 1924.28
| Levels | Levels.1 |
|---|---|
| Previous Daily High | 1915.79 |
| Previous Daily Low | 1905.59 |
| Previous Weekly High | 1946.35 |
| Previous Weekly Low | 1915.33 |
| Previous Monthly High | 1966.08 |
| Previous Monthly Low | 1884.85 |
| Daily Fibonacci 38.2% | 1909.49 |
| Daily Fibonacci 61.8% | 1911.89 |
| Daily Pivot Point S1 | 1903.88 |
| Daily Pivot Point S2 | 1899.63 |
| Daily Pivot Point S3 | 1893.68 |
| Daily Pivot Point R1 | 1914.08 |
| Daily Pivot Point R2 | 1920.03 |
| Daily Pivot Point R3 | 1924.28 |
[/s2If]
Download Nehcap EAWe have two EAs that are operational on our LIVE accounts.
- EA-FIX: Check out the details here. Download EA-FIX . EA-FIX is a non-grid HFT scalper.
- EA-GROWTH: High quality low dd EA using trend grids. Download EA_GROWTHJoin Our Telegram Group
")


