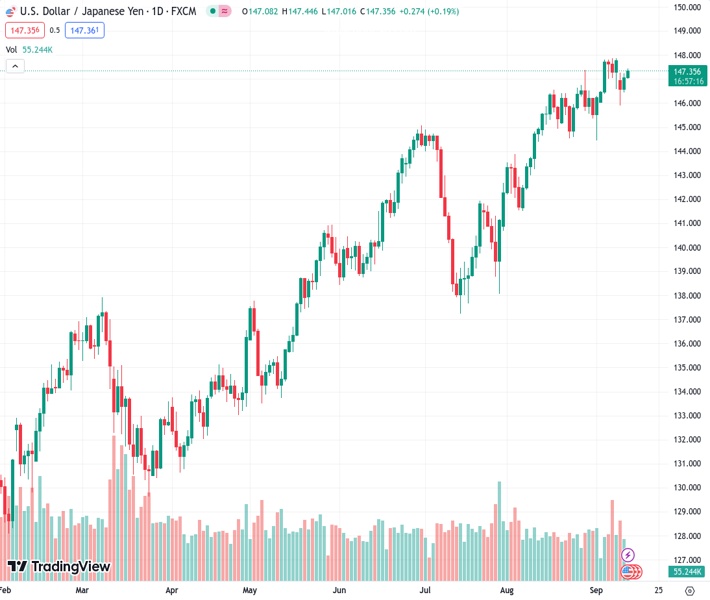
The USDJPY pair continues to rise for the second day in a row, reaching a new weekly high on Wednesday at 147.364.
…
This is a premium post.
[s2If !current_user_can(access_s2member_level4)]Please register for FREE REGISTER to read full post below containing analysis. In case of any error or you think you are not able to read the full post below, please email us at support#nehcap.com [lwa][/s2If] [s2If current_user_can(access_s2member_level1)]
- USD/JPY scales higher for the second successive day and climbs to a fresh weekly high on Wednesday.
The pair currently trades last at 147.364.
The previous day high was 147.24 while the previous day low was 146.44. The daily 38.2% Fib levels comes at 146.93, expected to provide support. Similarly, the daily 61.8% fib level is at 146.74, expected to provide support.
The USD/JPY pair builds on this week’s bounce from ascending trend-line support extending from the 138.00 mark, or the late July swing low, and gains some positive traction for the second successive day on Wednesday. Spot prices touch a fresh weekly top, around the 147.45 area during the Asian session, and remain well within the striking distance of the YTD peak set last Thursday.
The aforementioned trend-line support is currently pegged near the 146.40-146.35 region, which now coincides with the 100-period Simple Moving Average (SMA) on the 4-hour chart. This, in turn, should act as a pivotal point for short-term traders as the focus remains glued to the release of the latest US consumer inflation figures, due later during the early North American session. In the meantime, oscillators on the 4-hour chart have just started gaining positive traction. This, along with the fact that technical indicators on the daily chart are holding comfortably in the bullish territory, suggests that the path of least resistance for the USD/JPY pair is to the upside.
Hence, a subsequent strength back towards testing 147.85 region, or the highest level since November 2022, looks like a distinct possibility. Some follow-through buying beyond the 148.00 round-figure mark will be seen as a fresh trigger for bullish traders and pave the way for additional gains. The USD/JPY pair might then accelerate the momentum towards the 148.70-148.80 hurdle before aiming to conquer the 148.00 mark for the first time since October 2022. That said, speculations that Japanese authorities might interfere in the FX market to prop up the domestic currency might hold back bulls from placing fresh bets and cap any further gains for spot prices.
On the flip side, the 147.00 round figure now seems to protect the immediate downside ahead of the 146.35 confluence support. A convincing break below the latter might prompt aggressive technical selling and set the stage for a deeper corrective decline. The subsequent fall has the potential to drag the USD/JPY pair further below the 146.00 mark, towards testing the 145.30 intermediate support en route to the 145.00 psychological mark and the monthly swing low, around the 144.45 zone.
Technical Levels: Supports and Resistances
USDJPY currently trading at 147.35 at the time of writing. Pair opened at 147.08 and is trading with a change of 0.18 % .
| Overview | Overview.1 | |
|---|---|---|
| 0 | Today last price | 147.35 |
| 1 | Today Daily Change | 0.27 |
| 2 | Today Daily Change % | 0.18 |
| 3 | Today daily open | 147.08 |
The pair remains strongly bullish on the daily timeframe. It trades above its 20 SMA @ 146.4, 50 SMA 143.64, 100 SMA @ 141.43 and 200 SMA @ 137.19.
| Trends | Trends.1 | |
|---|---|---|
| 0 | Daily SMA20 | 146.40 |
| 1 | Daily SMA50 | 143.64 |
| 2 | Daily SMA100 | 141.43 |
| 3 | Daily SMA200 | 137.19 |
The previous day high was 147.24 while the previous day low was 146.44. The daily 38.2% Fib levels comes at 146.93, expected to provide support. Similarly, the daily 61.8% fib level is at 146.74, expected to provide support.
Note the levels of interest below:
- Pivot support is noted at 146.6, 146.12, 145.81
- Pivot resistance is noted at 147.4, 147.72, 148.2
| Levels | Levels.1 |
|---|---|
| Previous Daily High | 147.24 |
| Previous Daily Low | 146.44 |
| Previous Weekly High | 147.88 |
| Previous Weekly Low | 146.02 |
| Previous Monthly High | 147.38 |
| Previous Monthly Low | 141.51 |
| Daily Fibonacci 38.2% | 146.93 |
| Daily Fibonacci 61.8% | 146.74 |
| Daily Pivot Point S1 | 146.60 |
| Daily Pivot Point S2 | 146.12 |
| Daily Pivot Point S3 | 145.81 |
| Daily Pivot Point R1 | 147.40 |
| Daily Pivot Point R2 | 147.72 |
| Daily Pivot Point R3 | 148.20 |
[/s2If]
Download Nehcap EAWe have two EAs that are operational on our LIVE accounts.
- EA-FIX: Check out the details here. Download EA-FIX . EA-FIX is a non-grid HFT scalper.
- EA-GROWTH: High quality low dd EA using trend grids. Download EA_GROWTHJoin Our Telegram Group
")


