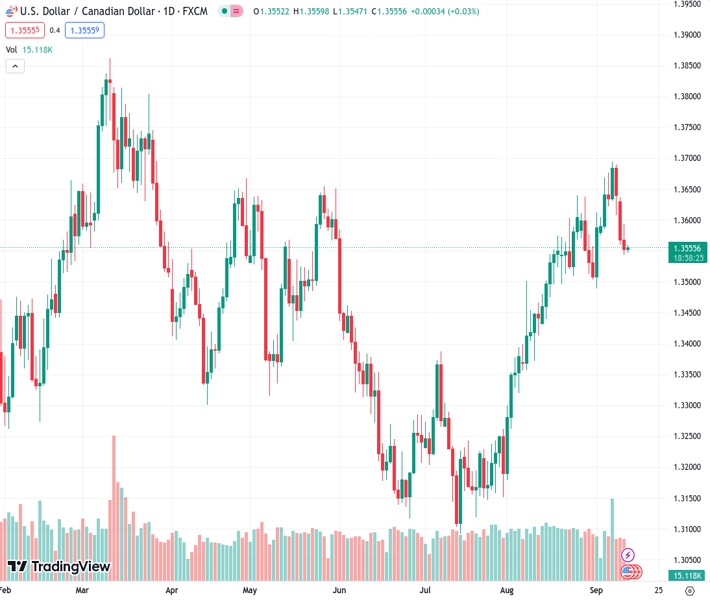
The USDCAD currency pair, currently trading at a rate of 1.35575, is experiencing a period of consolidation with a bearish sentiment. This consolidation phase is occurring at a level close to the lowest point reached in the past week and a half, which was observed on Tuesday.
…
This is a premium post.
[s2If !current_user_can(access_s2member_level4)]Please register for FREE REGISTER to read full post below containing analysis. In case of any error or you think you are not able to read the full post below, please email us at support#nehcap.com [lwa][/s2If] [s2If current_user_can(access_s2member_level1)]
- USD/CAD enters a bearish consolidation phase near a one-and-half-week low set on Tuesday.
The pair currently trades last at 1.35575.
The previous day high was 1.3593 while the previous day low was 1.3544. The daily 38.2% Fib levels comes at 1.3563, expected to provide resistance. Similarly, the daily 61.8% fib level is at 1.3574, expected to provide resistance.
The USD/CAD pair is seen oscillating in a range just above mid-1.3500s during the Asian session on Wednesday and consolidating its losses registered over the past three days, to a a one-and-half-week low touched the previous day.
Crude Oil prices stand tall near a 10-month high and remain well supported by concerns about tighter global supplies. The Organization of Petroleum Exporting Countries (OPEC) said in its monthly report on Tuesday that oil markets will tighten further this year amid robust demand and lower production. This comes on top of deeper supply cuts announced by Saudi Arabia and Russia – the world’s two biggest Oil producers – for the remainder of 2023 and continues to benefit the black liquid. Bullish Oil prices underpin the commodity-linked Loonie, which, along with subdued US Dollar (USD) price action, acts as a headwind for the USD/CAD pair.
The USD Index (DXY), which tracks the Greenback against a basket of currencies, languishes near the weekly low as traders seem reluctant to place aggressive bets ahead of the US consumer inflation figures, due later during the North American session. The crucial US CPI report might provide fresh cues about the Federal Reserve’s (Fed) future rate-hike path. This, in turn, will play a key role in influencing the USD and help determine the next leg of a directional move for the USD/CAD pair. In the meantime, bets for one more 25 bps Fed rate hike move by the end of this year remain supportive of elevated US Treasury bond yields and limit the USD downside.
Investors seem convinced that the US central bank will stick to its hawkish stance and keep interest rates higher for longer. The expectations were reaffirmed by the upbeat US macro data released last week, which pointed to a still resilient economy. Adding to this, the fact that inflation is not cooling fast enough supports prospects for further policy tightening by the Fed. This, in turn, warrants some caution before positioning for an extension of the USD/CAD pair’s recent retracement slide from the vicinity of the 1.3700 mark, or its highest level since March touched last week.
Technical Levels: Supports and Resistances
USDCAD currently trading at 1.3559 at the time of writing. Pair opened at 1.3554 and is trading with a change of 0.04 % .
| Overview | Overview.1 | |
|---|---|---|
| 0 | Today last price | 1.3559 |
| 1 | Today Daily Change | 0.0005 |
| 2 | Today Daily Change % | 0.0400 |
| 3 | Today daily open | 1.3554 |
The pair is trading below its 20 Daily moving average @ 1.3577, above its 50 Daily moving average @ 1.3401 , above its 100 Daily moving average @ 1.3405 and above its 200 Daily moving average @ 1.3467
| Trends | Trends.1 | |
|---|---|---|
| 0 | Daily SMA20 | 1.3577 |
| 1 | Daily SMA50 | 1.3401 |
| 2 | Daily SMA100 | 1.3405 |
| 3 | Daily SMA200 | 1.3467 |
The previous day high was 1.3593 while the previous day low was 1.3544. The daily 38.2% Fib levels comes at 1.3563, expected to provide resistance. Similarly, the daily 61.8% fib level is at 1.3574, expected to provide resistance.
Note the levels of interest below:
- Pivot support is noted at 1.3534, 1.3514, 1.3484
- Pivot resistance is noted at 1.3583, 1.3613, 1.3633
| Levels | Levels.1 |
|---|---|
| Previous Daily High | 1.3593 |
| Previous Daily Low | 1.3544 |
| Previous Weekly High | 1.3694 |
| Previous Weekly Low | 1.3576 |
| Previous Monthly High | 1.3640 |
| Previous Monthly Low | 1.3184 |
| Daily Fibonacci 38.2% | 1.3563 |
| Daily Fibonacci 61.8% | 1.3574 |
| Daily Pivot Point S1 | 1.3534 |
| Daily Pivot Point S2 | 1.3514 |
| Daily Pivot Point S3 | 1.3484 |
| Daily Pivot Point R1 | 1.3583 |
| Daily Pivot Point R2 | 1.3613 |
| Daily Pivot Point R3 | 1.3633 |
[/s2If]
Download Nehcap EAWe have two EAs that are operational on our LIVE accounts.
- EA-FIX: Check out the details here. Download EA-FIX . EA-FIX is a non-grid HFT scalper.
- EA-GROWTH: High quality low dd EA using trend grids. Download EA_GROWTHJoin Our Telegram Group
")


