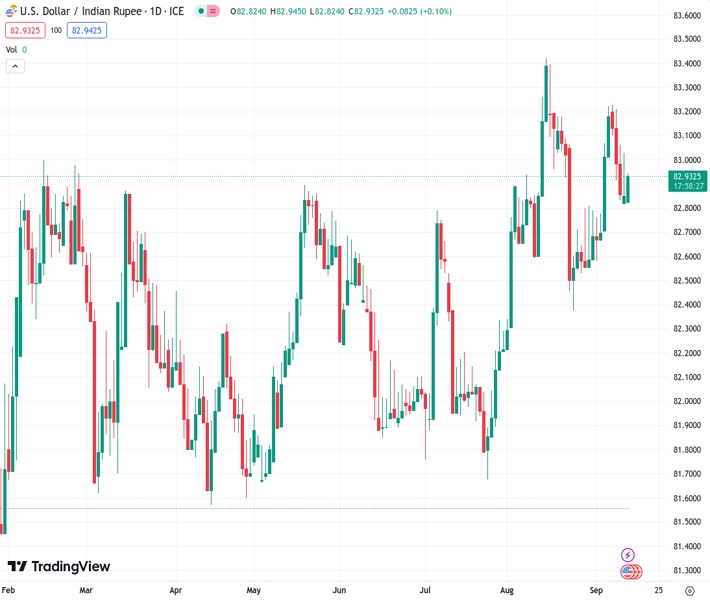
The USD to INR exchange rate stays near 82.90 due to increased demand for the USD.
…
This is a premium post.
[s2If !current_user_can(access_s2member_level4)]Please register for FREE REGISTER to read full post below containing analysis. In case of any error or you think you are not able to read the full post below, please email us at support#nehcap.com [lwa][/s2If] [s2If current_user_can(access_s2member_level1)]
- USD/INR hovers around 82.90 amid the renewed USD demand.
The pair currently trades last at 82.9230.
The previous day high was 83.2766 while the previous day low was 82.7965. The daily 38.2% Fib levels comes at 82.9799, expected to provide resistance. Similarly, the daily 61.8% fib level is at 83.0932, expected to provide resistance.
USD/INR snaps four-day losing streaks after bouncing off the weekly low of 82.80 during the Asian session on Wednesday. The pair currently trades around 82.90, gaining 0.09% on the day. The market turns cautious ahead of the US Consumer Price Index (CPI) for August. The US CPI figure is expected to rise by 0.5%, while the core monthly figure is expected to remain at 0.2%.
Data released from the National Statistical Office (NSO) on Tuesday revealed that the Indian Consumer Price Index (CPI) for August came in at 6.83% YoY from 7.44% in July, below the market expectation of 7.0%. The August inflation gauge is lower than the 15-month high of 7.44% reported in July. However, inflation has risen over the upper bound of the Reserve Bank of India’s (RBI) tolerance level of 2-6% for the second month in a row. Additionally, Indian Industrial Production for July surged 5.7% YoY from 3.7% in the previous reading, beating the market estimation of 5.0%
The RBI is anticipated to keep its monetary policy unchanged until inflation shows signs of consistently nearing 4%, but will consider further tightening measures if inflation remains over 7%.
On the other hand, the US Dollar (USD) may benefit from the higher for longer interest rate narrative in the US. According to the CME Fedwatch Tool, traders expect the Federal Reserve (Fed) to keep the interest rate unchanged in September at 5.25%-5.50%, with a 93% chance. Meanwhile, the market has priced in 40.8% of the odds of a rate hike in the November meeting. This, in turn, might boost the Greenback against the Indian Rupee (INR) and act as a tailwind for the USD/INR pair.
Looking ahead, market players will closely watch the US Consumer Price Index (CPI) data on Wednesday. Later this week, the US Retail Sales and Producer Price Index (PPI) will be released on Thursday while Indian Exports and Imports data will be due on Friday. These figures could give a clear direction to the USD/INR pair.
Technical Levels: Supports and Resistances
USDINR currently trading at 82.9212 at the time of writing. Pair opened at 82.8298 and is trading with a change of 0.11 % .
| Overview | Overview.1 | |
|---|---|---|
| 0 | Today last price | 82.9212 |
| 1 | Today Daily Change | 0.0914 |
| 2 | Today Daily Change % | 0.1100 |
| 3 | Today daily open | 82.8298 |
The pair remains strongly bullish on the daily timeframe. It trades above its 20 SMA @ 82.9121, 50 SMA 82.6413, 100 SMA @ 82.4238 and 200 SMA @ 82.3369.
| Trends | Trends.1 | |
|---|---|---|
| 0 | Daily SMA20 | 82.9121 |
| 1 | Daily SMA50 | 82.6413 |
| 2 | Daily SMA100 | 82.4238 |
| 3 | Daily SMA200 | 82.3369 |
The previous day high was 83.2766 while the previous day low was 82.7965. The daily 38.2% Fib levels comes at 82.9799, expected to provide resistance. Similarly, the daily 61.8% fib level is at 83.0932, expected to provide resistance.
Note the levels of interest below:
- Pivot support is noted at 82.6586, 82.4875, 82.1785
- Pivot resistance is noted at 83.1388, 83.4478, 83.6189
| Levels | Levels.1 |
|---|---|
| Previous Daily High | 83.2766 |
| Previous Daily Low | 82.7965 |
| Previous Weekly High | 83.3714 |
| Previous Weekly Low | 82.5850 |
| Previous Monthly High | 83.5505 |
| Previous Monthly Low | 82.2240 |
| Daily Fibonacci 38.2% | 82.9799 |
| Daily Fibonacci 61.8% | 83.0932 |
| Daily Pivot Point S1 | 82.6586 |
| Daily Pivot Point S2 | 82.4875 |
| Daily Pivot Point S3 | 82.1785 |
| Daily Pivot Point R1 | 83.1388 |
| Daily Pivot Point R2 | 83.4478 |
| Daily Pivot Point R3 | 83.6189 |
[/s2If]
Download Nehcap EAWe have two EAs that are operational on our LIVE accounts.
- EA-FIX: Check out the details here. Download EA-FIX . EA-FIX is a non-grid HFT scalper.
- EA-GROWTH: High quality low dd EA using trend grids. Download EA_GROWTHJoin Our Telegram Group
")


