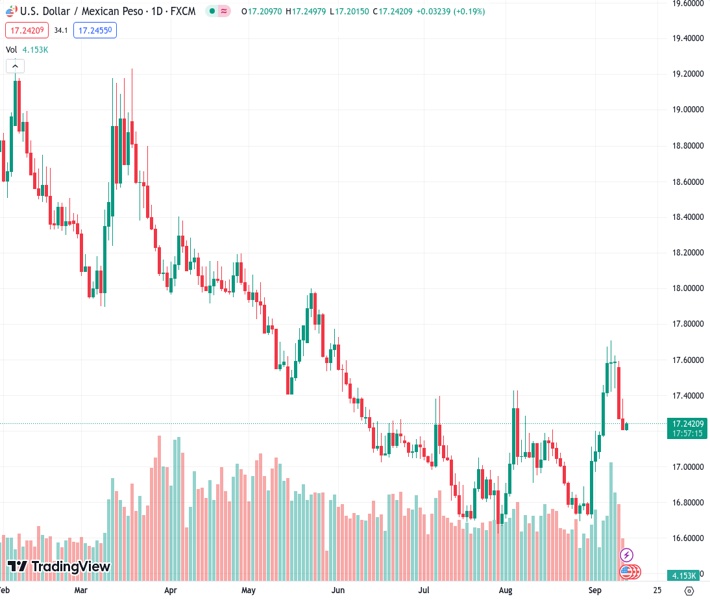
The US dollar to Mexican peso exchange rate, currently at 17.2415, is stabilizing after experiencing a decline and reaching a low point last Tuesday, which it has maintained for one and a half weeks.
…
This is a premium post.
[s2If !current_user_can(access_s2member_level4)]Please register for FREE REGISTER to read full post below containing analysis. In case of any error or you think you are not able to read the full post below, please email us at support#nehcap.com [lwa][/s2If] [s2If current_user_can(access_s2member_level1)]
- USD/MXN consolidates its recent losses to a one-and-half-week trough touched on Tuesday.
The pair currently trades last at 17.2415.
The previous day high was 17.3811 while the previous day low was 17.2167. The daily 38.2% Fib levels comes at 17.2795, expected to provide resistance. Similarly, the daily 61.8% fib level is at 17.3183, expected to provide resistance.
The USD/MXN pair struggles to gain any meaningful traction during the Asian session on Wednesday and consolidates its recent losses to a one-week low touched the previous day. Spot prices currently trade just above the 17.20 area, which represents the 50% Fibonacci retracement level of the rally from the August monthly swing low and should act as a pivotal point for intraday traders.
The overnight sustained breakdown through the 100-day Simple Moving Average (SMA) was seen as a fresh trigger for bears. That said, technical indicators on the daily chart –though have been easing from higher levels – are still holding in the positive territory. This, in turn, supports prospects for the emergence of some dip-buying at lower levels and warrants caution before positioning for any further depreciating move.
Some follow-through selling below the 17.20 level (50% Fibo.), however, has the potential to drag the USD/MXN pair to the 17.10 level, or the 61.8% Fibo. level. This is followed by the 17.00 round-figure mark, which if broken decisively will make spot prices vulnerable to weaken further towards the 16.90 area en route to the 16.70 region (August 28 low).
On the flip side, the 38.2% Fibo. level, around the 17.35 region, is likely to cap the immediate upside, above which the USD/MXN pair could climb to the 17.45-17.50 hurdle, or the 23.6% Fibo. level. This is followed by the multi-month top, around the 17.70 zone, which if cleared decisively will set the stage for the resumption of the recent strong appreciating move witnessed over the past two weeks or so.
Technical Levels: Supports and Resistances
USDMXN currently trading at 17.2422 at the time of writing. Pair opened at 17.2274 and is trading with a change of 0.09 % .
| Overview | Overview.1 | |
|---|---|---|
| 0 | Today last price | 17.2422 |
| 1 | Today Daily Change | 0.0148 |
| 2 | Today Daily Change % | 0.0900 |
| 3 | Today daily open | 17.2274 |
The pair is trading above its 20 Daily moving average @ 17.0964, above its 50 Daily moving average @ 17.0159 , below its 100 Daily moving average @ 17.2617 and below its 200 Daily moving average @ 17.9948
| Trends | Trends.1 | |
|---|---|---|
| 0 | Daily SMA20 | 17.0964 |
| 1 | Daily SMA50 | 17.0159 |
| 2 | Daily SMA100 | 17.2617 |
| 3 | Daily SMA200 | 17.9948 |
The previous day high was 17.3811 while the previous day low was 17.2167. The daily 38.2% Fib levels comes at 17.2795, expected to provide resistance. Similarly, the daily 61.8% fib level is at 17.3183, expected to provide resistance.
Note the levels of interest below:
- Pivot support is noted at 17.1691, 17.1107, 17.0047
- Pivot resistance is noted at 17.3335, 17.4395, 17.4979
| Levels | Levels.1 |
|---|---|
| Previous Daily High | 17.3811 |
| Previous Daily Low | 17.2167 |
| Previous Weekly High | 17.7094 |
| Previous Weekly Low | 17.0447 |
| Previous Monthly High | 17.4274 |
| Previous Monthly Low | 16.6945 |
| Daily Fibonacci 38.2% | 17.2795 |
| Daily Fibonacci 61.8% | 17.3183 |
| Daily Pivot Point S1 | 17.1691 |
| Daily Pivot Point S2 | 17.1107 |
| Daily Pivot Point S3 | 17.0047 |
| Daily Pivot Point R1 | 17.3335 |
| Daily Pivot Point R2 | 17.4395 |
| Daily Pivot Point R3 | 17.4979 |
[/s2If]
Download Nehcap EAWe have two EAs that are operational on our LIVE accounts.
- EA-FIX: Check out the details here. Download EA-FIX . EA-FIX is a non-grid HFT scalper.
- EA-GROWTH: High quality low dd EA using trend grids. Download EA_GROWTHJoin Our Telegram Group
")


