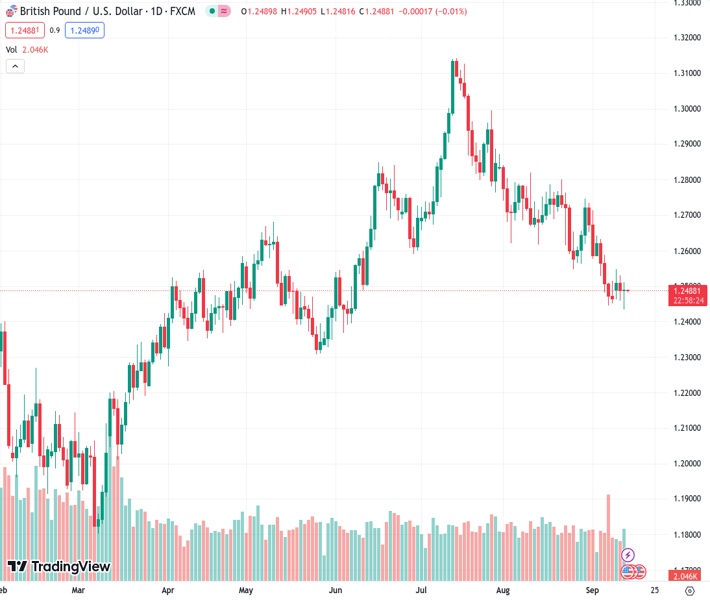
The GBPUSD currency pair maintained its stability at 1.2485 on Wednesday, with a rate of 1.24878.
…
This is a premium post.
[s2If !current_user_can(access_s2member_level4)]Please register for FREE REGISTER to read full post below containing analysis. In case of any error or you think you are not able to read the full post below, please email us at support#nehcap.com [lwa][/s2If] [s2If current_user_can(access_s2member_level1)]
- GBP/USD held steady at 1.2485 on Wednesday.
The pair currently trades last at 1.24878.
The previous day high was 1.2531 while the previous day low was 1.2459. The daily 38.2% Fib levels comes at 1.2487, expected to provide support. Similarly, the daily 61.8% fib level is at 1.2504, expected to provide resistance.
On Wednesday, the GBP/USD closed the session with mild gains, at 1.2485. Bears managed to take the Cable to 1.2433 earlier in the session, near the 200-day Simple Moving Average area, but the bulls quickly reversed the fall.
Following the sharp decline seen at the beginning of last week, which saw the Cable declining by nearly 1%, the bears seem to be running out of steam, with little gas left in the tank to break below the key 200-day SMA. In that sense, on the daily chart, the Relative Strength Index (RSI) is comfortably positioned in the negative territory below its midline and has a flat slope, complemented by a negative signal from the Moving Average Convergence Divergence (MACD), which is showing red bars. Unless bears manage to gather momentum, the Cable may side-ways trade above the 1.2430 area in the next sessions to consolidate losses. That being said, traders should eye the slope of the 20-day SMA, which suggests that it is en-route to perform a bearish cross with the 200-day SMA and that could be the sparkle that reignites the bearish momentum.
If the bulls fail to defend the 200-day SMA, support below line up at 1.2400, 1.2370, and 1.2350. On the other hand, the next targets for the buyers are seen at 1.2500, 1.2540-50 and the 20-day SMA at 1.2600.
Technical Levels: Supports and Resistances
GBPUSD currently trading at 1.2487 at the time of writing. Pair opened at 1.249 and is trading with a change of -0.02 % .
| Overview | Overview.1 | |
|---|---|---|
| 0 | Today last price | 1.2487 |
| 1 | Today Daily Change | -0.0003 |
| 2 | Today Daily Change % | -0.0200 |
| 3 | Today daily open | 1.2490 |
The pair is trading below its 20 Daily moving average @ 1.2624, below its 50 Daily moving average @ 1.2753 , below its 100 Daily moving average @ 1.2656 and above its 200 Daily moving average @ 1.243
| Trends | Trends.1 | |
|---|---|---|
| 0 | Daily SMA20 | 1.2624 |
| 1 | Daily SMA50 | 1.2753 |
| 2 | Daily SMA100 | 1.2656 |
| 3 | Daily SMA200 | 1.2430 |
The previous day high was 1.2531 while the previous day low was 1.2459. The daily 38.2% Fib levels comes at 1.2487, expected to provide support. Similarly, the daily 61.8% fib level is at 1.2504, expected to provide resistance.
Note the levels of interest below:
- Pivot support is noted at 1.2456, 1.2422, 1.2385
- Pivot resistance is noted at 1.2527, 1.2565, 1.2599
| Levels | Levels.1 |
|---|---|
| Previous Daily High | 1.2531 |
| Previous Daily Low | 1.2459 |
| Previous Weekly High | 1.2643 |
| Previous Weekly Low | 1.2446 |
| Previous Monthly High | 1.2841 |
| Previous Monthly Low | 1.2548 |
| Daily Fibonacci 38.2% | 1.2487 |
| Daily Fibonacci 61.8% | 1.2504 |
| Daily Pivot Point S1 | 1.2456 |
| Daily Pivot Point S2 | 1.2422 |
| Daily Pivot Point S3 | 1.2385 |
| Daily Pivot Point R1 | 1.2527 |
| Daily Pivot Point R2 | 1.2565 |
| Daily Pivot Point R3 | 1.2599 |
[/s2If]
Download Nehcap EAWe have two EAs that are operational on our LIVE accounts.
- EA-FIX: Check out the details here. Download EA-FIX . EA-FIX is a non-grid HFT scalper.
- EA-GROWTH: High quality low dd EA using trend grids. Download EA_GROWTHJoin Our Telegram Group
")


