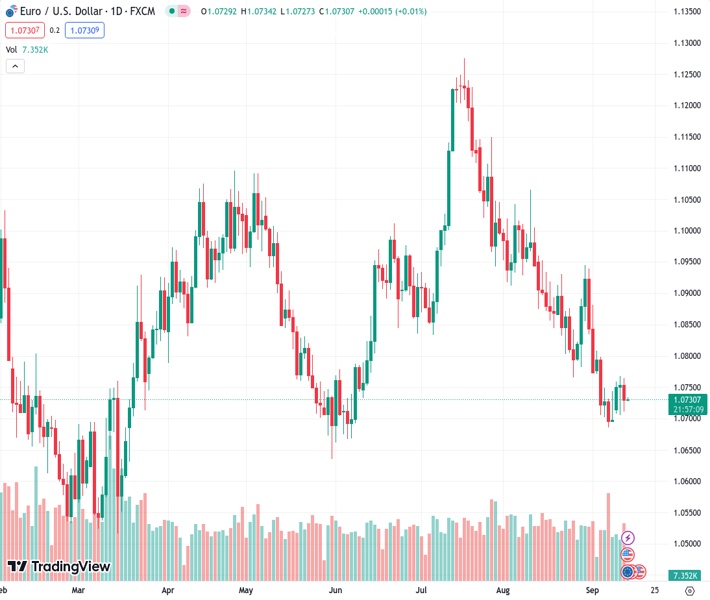
The EURUSD pair declined on Wednesday due to uninspiring US CPI data, leading to a lack of significant market reaction.
…
This is a premium post.
[s2If !current_user_can(access_s2member_level4)]Please register for FREE REGISTER to read full post below containing analysis. In case of any error or you think you are not able to read the full post below, please email us at support#nehcap.com [lwa][/s2If] [s2If current_user_can(access_s2member_level1)]
- The EUR/USD slid on Wednesday as US CPI figures failed to inspire markets meaningfully.
The pair currently trades last at 1.07327.
The previous day high was 1.0769 while the previous day low was 1.0705. The daily 38.2% Fib levels comes at 1.0745, expected to provide resistance. Similarly, the daily 61.8% fib level is at 1.073, expected to provide support.
The EUR/USD is down into the red for heading into Thursday’s market session, wrapping up Wednesday down around 1.0730 after opening the day above 1.0750 and tapping into 1.0711 for the trading day’s low.
It’s all about the European Central Bank (ECB) heading into Thursday after markets largely shrugged off the US Consumer Price Index (CPI) beat, which showed US inflation ticking upwards to 3.7% for the annualized period into August, beating market analyst estimates of 3.5% and a healthy step up from the previous month’s 3.2% showing.
The ECB is slated for another rate call on Thursday, with the European Union’s (EU) preeminent bank largely forecast to hold on rates for the time being, but inflationary concerns remain a sticking point.
ECB Preview: Forecasts from 10 major banks, a hike or a hawkish pause?
The majority of market analysts anticipate the ECB to hold steady on rates, but the margin has dwindled rapidly in recent days after an internal leak from the ECB showed the bank is set to raise their inflation expectations looking forward.
A poor showing from the ECB here could see the Euro (EUR) extend its current backslide against the Greenback (USD).
While the projection increase itself is unlikely to be enough to push the ECB off their wait-and-see stance, it does highlight that inflation remains an ongoing issue for the broader European economy.
The EUR/USD is notably on the soft side, trading into the 1.0700 major handle on the daily candlesticks. Price action has steadily declined from late July’s peaks near 1.1240, and has closed red for the past eight consecutive weeks.
While the 50- and 100-day Simple Moving Averages are still stacked bullish, with the 50-day SMA nearing 1.0925 and the 100-day SMA near 1.0900, both moving averages have turned bearish, descending into a rejection zone that has thus far held the EUR/USD on the back foot since late August’s failed bull run.
Look for any topside momentum to get capped by resistance points at lower highs, and a break below the 1.0700 handle could see bears find room to run.
Technical Levels: Supports and Resistances
EURUSD currently trading at 1.0733 at the time of writing. Pair opened at 1.0754 and is trading with a change of -0.2 % .
| Overview | Overview.1 | |
|---|---|---|
| 0 | Today last price | 1.0733 |
| 1 | Today Daily Change | -0.0021 |
| 2 | Today Daily Change % | -0.2000 |
| 3 | Today daily open | 1.0754 |
The pair remains strongly bearish on the daily time frame. It trades below the 20 SMA @ 1.0811, 50 SMA 1.0944, 100 SMA @ 1.0905 and 200 SMA @ 1.0826.
| Trends | Trends.1 | |
|---|---|---|
| 0 | Daily SMA20 | 1.0811 |
| 1 | Daily SMA50 | 1.0944 |
| 2 | Daily SMA100 | 1.0905 |
| 3 | Daily SMA200 | 1.0826 |
The previous day high was 1.0769 while the previous day low was 1.0705. The daily 38.2% Fib levels comes at 1.0745, expected to provide resistance. Similarly, the daily 61.8% fib level is at 1.073, expected to provide support.
Note the levels of interest below:
- Pivot support is noted at 1.0717, 1.0679, 1.0653
- Pivot resistance is noted at 1.078, 1.0806, 1.0844
| Levels | Levels.1 |
|---|---|
| Previous Daily High | 1.0769 |
| Previous Daily Low | 1.0705 |
| Previous Weekly High | 1.0809 |
| Previous Weekly Low | 1.0686 |
| Previous Monthly High | 1.1065 |
| Previous Monthly Low | 1.0766 |
| Daily Fibonacci 38.2% | 1.0745 |
| Daily Fibonacci 61.8% | 1.0730 |
| Daily Pivot Point S1 | 1.0717 |
| Daily Pivot Point S2 | 1.0679 |
| Daily Pivot Point S3 | 1.0653 |
| Daily Pivot Point R1 | 1.0780 |
| Daily Pivot Point R2 | 1.0806 |
| Daily Pivot Point R3 | 1.0844 |
[/s2If]
Download Nehcap EAWe have two EAs that are operational on our LIVE accounts.
- EA-FIX: Check out the details here. Download EA-FIX . EA-FIX is a non-grid HFT scalper.
- EA-GROWTH: High quality low dd EA using trend grids. Download EA_GROWTHJoin Our Telegram Group
")


