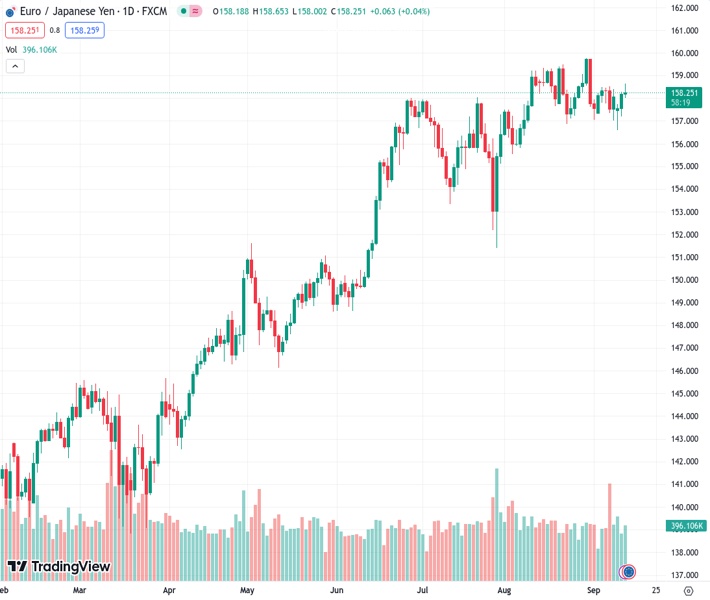
The EURJPY is currently trading at 158.22, which is a slight increase of 0.02%. This price movement is influenced by recent US inflation data, indicating that the Federal Reserve might delay a potential interest rate increase.
…
This is a premium post.
[s2If !current_user_can(access_s2member_level4)]Please register for FREE REGISTER to read full post below containing analysis. In case of any error or you think you are not able to read the full post below, please email us at support#nehcap.com [lwa][/s2If] [s2If current_user_can(access_s2member_level1)]
- EUR/JPY trades at 158.22, up 0.02%, after US inflation data suggests the Fed may hold off on a rate hike.
The pair currently trades last at 158.245.
The previous day high was 158.29 while the previous day low was 157.18. The daily 38.2% Fib levels comes at 157.87, expected to provide support. Similarly, the daily 61.8% fib level is at 157.61, expected to provide support.
The EUR/JPY clings to minuscule gains after reaching a two-week high of 158.65, following the release of US inflation data, which was mixed and cemented the US central bank case to skip a rate hike. The cross-currency pair changes hands at 158.22, climbing 0.02%.
According to the Ichimoku Cloud (Kumo), the pair is upward biased, but the space contraction between price action and the Kumo suggests the EUR/JPY is consolidating. From a price action standpoint, the cross is neutral to downward biased, unable to crack the latest swing low of 156.58. Once done, the bias would shift to a downward bias, yet it needs to clear the Kumo.
Short term, the EUR/JPY hourly chart portrays the formation of a double top, as the pair peaked at around the 158.60 area. To confirm its validity, sellers must break the last lower low at 158.00. Once cleared, the next support would be the Senko-span A at 157.91, followed by the 157.83 swing low. The double-top measured profit objective would be the bottom of the Kumo at 157.40.
Technical Levels: Supports and Resistances
EURJPY currently trading at 158.25 at the time of writing. Pair opened at 158.26 and is trading with a change of -0.01 % .
| Overview | Overview.1 | |
|---|---|---|
| 0 | Today last price | 158.25 |
| 1 | Today Daily Change | -0.01 |
| 2 | Today Daily Change % | -0.01 |
| 3 | Today daily open | 158.26 |
The pair is trading below its 20 Daily moving average @ 158.26, above its 50 Daily moving average @ 157.16 , above its 100 Daily moving average @ 154.22 and above its 200 Daily moving average @ 148.54
| Trends | Trends.1 | |
|---|---|---|
| 0 | Daily SMA20 | 158.26 |
| 1 | Daily SMA50 | 157.16 |
| 2 | Daily SMA100 | 154.22 |
| 3 | Daily SMA200 | 148.54 |
The previous day high was 158.29 while the previous day low was 157.18. The daily 38.2% Fib levels comes at 157.87, expected to provide support. Similarly, the daily 61.8% fib level is at 157.61, expected to provide support.
Note the levels of interest below:
- Pivot support is noted at 157.53, 156.8, 156.42
- Pivot resistance is noted at 158.64, 159.02, 159.75
| Levels | Levels.1 |
|---|---|
| Previous Daily High | 158.29 |
| Previous Daily Low | 157.18 |
| Previous Weekly High | 158.52 |
| Previous Weekly Low | 157.00 |
| Previous Monthly High | 159.76 |
| Previous Monthly Low | 155.53 |
| Daily Fibonacci 38.2% | 157.87 |
| Daily Fibonacci 61.8% | 157.61 |
| Daily Pivot Point S1 | 157.53 |
| Daily Pivot Point S2 | 156.80 |
| Daily Pivot Point S3 | 156.42 |
| Daily Pivot Point R1 | 158.64 |
| Daily Pivot Point R2 | 159.02 |
| Daily Pivot Point R3 | 159.75 |
[/s2If]
Download Nehcap EAWe have two EAs that are operational on our LIVE accounts.
- EA-FIX: Check out the details here. Download EA-FIX . EA-FIX is a non-grid HFT scalper.
- EA-GROWTH: High quality low dd EA using trend grids. Download EA_GROWTHJoin Our Telegram Group
")


